
How to Use the FX Terminal
A complete walkthrough of every section in the dashboard — what each widget shows, where the data comes from, and how to use it to monitor FX market conditions.
Watch the full walkthroughTerminal Layout
The terminal uses a three-column layout at full width — a left sidebar, a wide main content area, and a right panel. By default it loads in split layout mode: the main area is divided into a left column (chart, FX table, heatmap) and a right column (risk, rates, COT, sessions). Understanding the structure helps you navigate quickly:
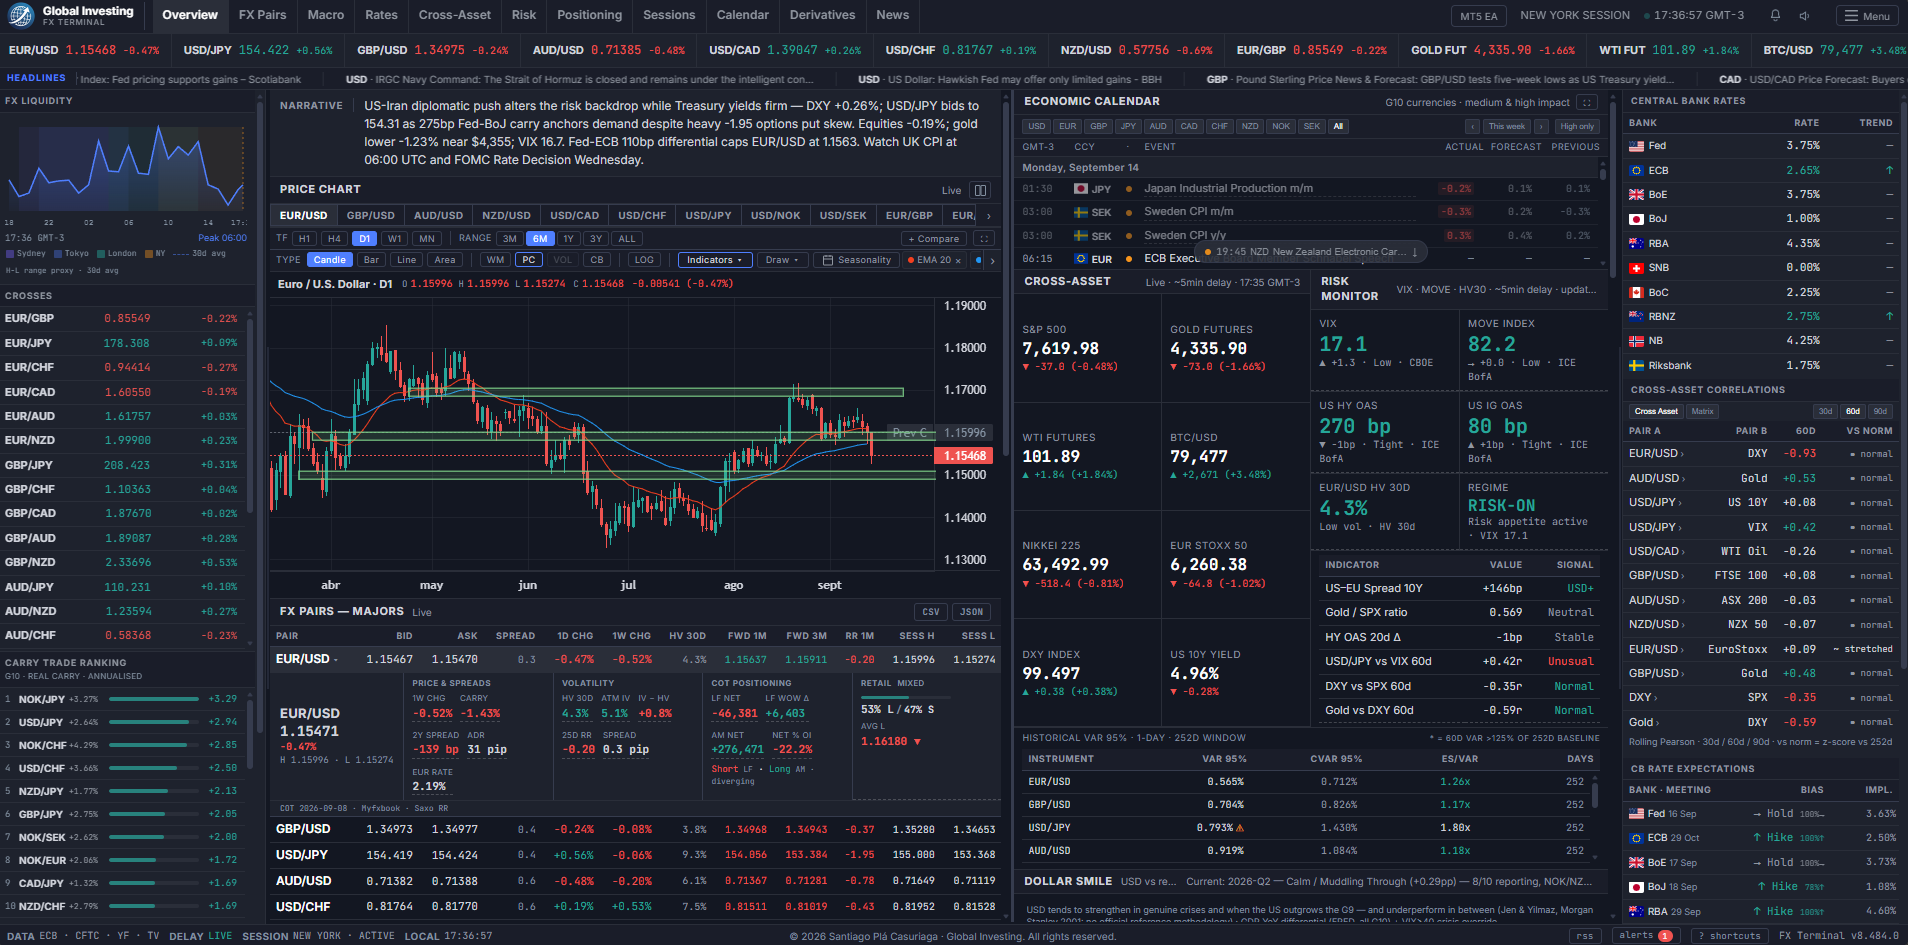
Split Layout
The main content area is split into two scrollable columns by default — the chart, FX table, and heatmap on the left; cross-asset, risk, rates, COT, sessions, and signals on the right. This is the recommended view on desktop as it keeps the chart visible while scrolling through data panels on the right. The split ratio is adjustable: drag the vertical divider bar between the two columns left or right to resize. Your preferred split width is saved automatically.
To toggle split mode on or off, click the split icon button — two vertical bars, side by side — in the top-right corner of the Price Chart panel header — next to the panel subtitle. When split layout is active, the button is highlighted in blue. Clicking it again collapses back to a single full-width scroll. Split layout is disabled automatically on mobile viewports.
On mobile, the layout collapses into a single scrollable column regardless of the split setting. The sidebar and right panel fold into the main flow.
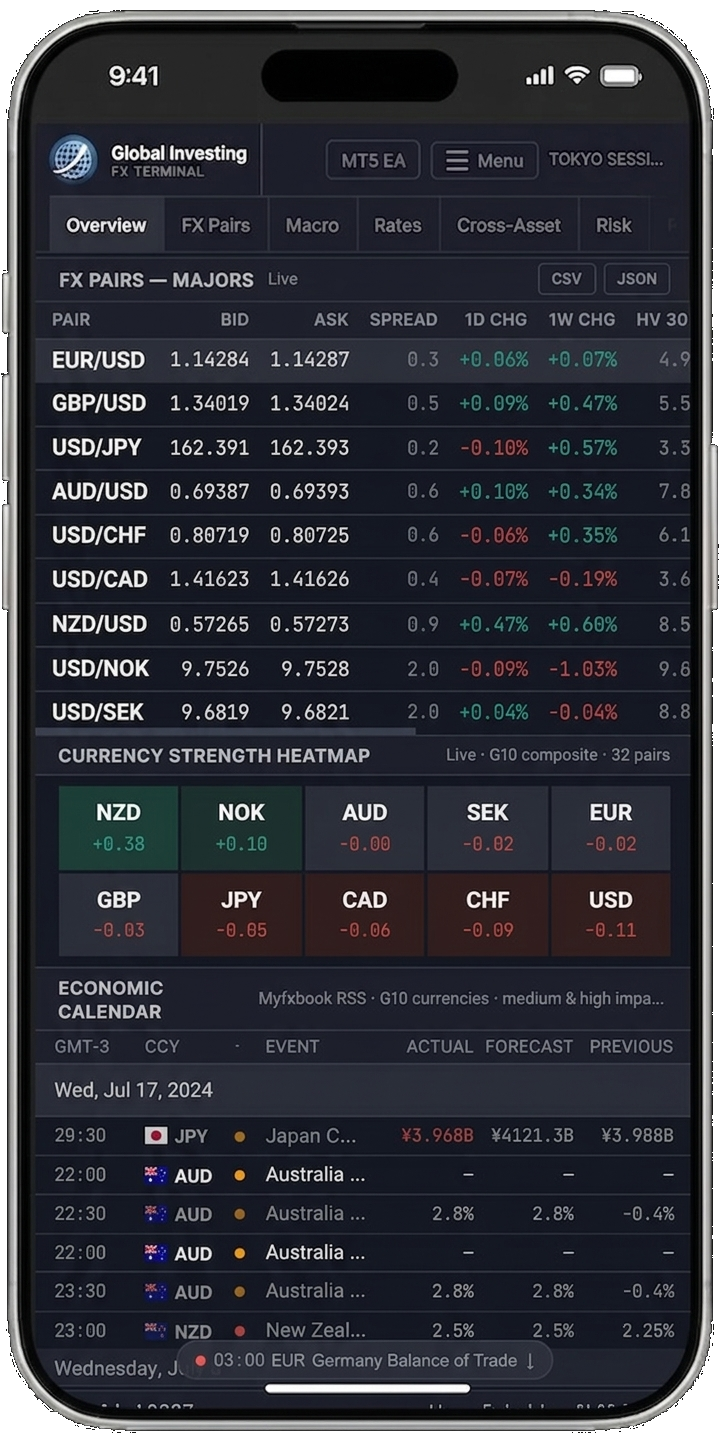
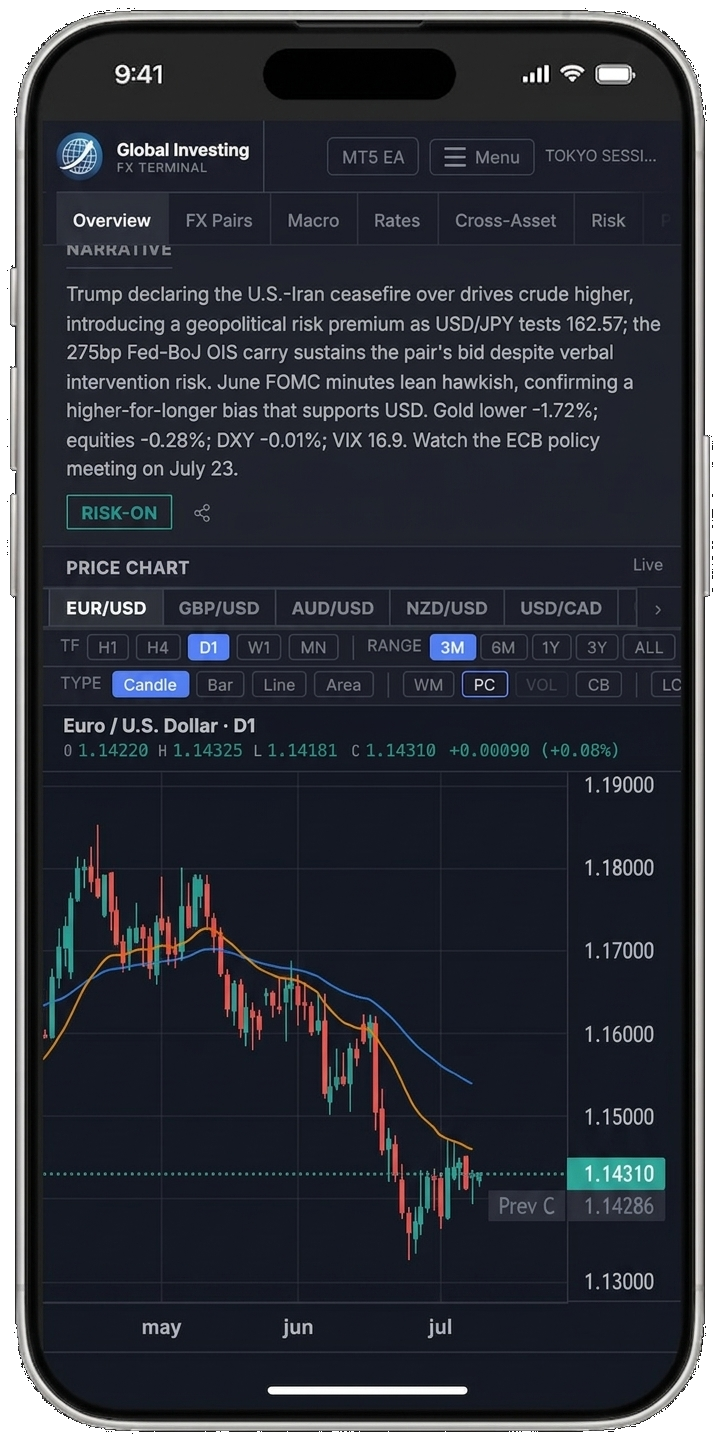
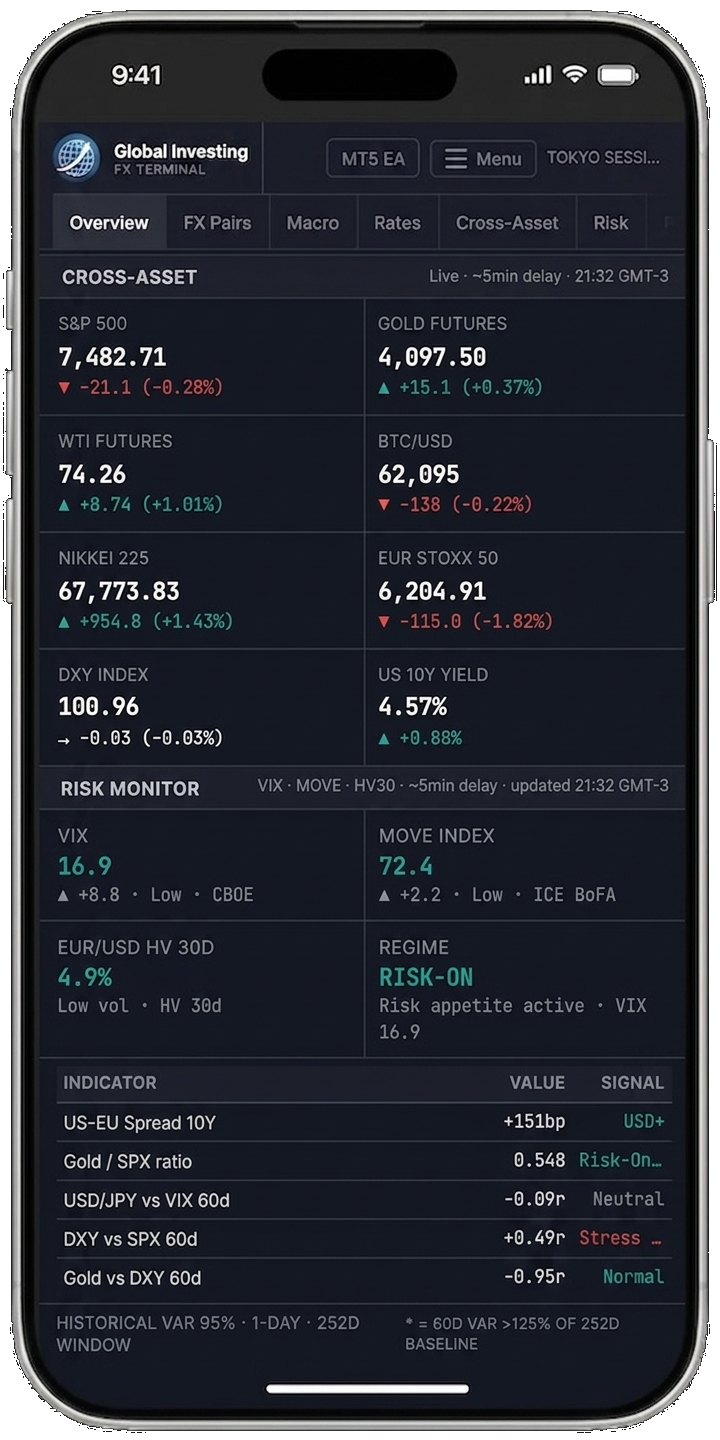
The sticky topbar navigation links jump you directly to major sections: FX Pairs, Macro, Rates, Cross-Asset, Risk, Positioning, Calendar, Derivatives, and News.
Topbar & Quote Bar

Session indicator
The top-right of the topbar shows the current active trading session (Sydney, Tokyo, London, New York, or an overlap) based on your browser's local time converted to UTC. A blinking green dot indicates the clock is live.
Quote bar
The horizontal strip below the topbar shows live prices for EUR/USD, USD/JPY, GBP/USD, AUD/USD, USD/CAD, USD/CHF, NZD/USD, EUR/GBP, GOLD FUT, WTI FUT, BTC/USD, US 10Y Yield, and DXY. FX pair prices update in real time during market hours via WebSocket (tick-by-tick). Non-FX instruments (Gold, WTI, BTC, US 10Y, DXY) update every ~5 min; on days when the primary feed appears frozen (e.g. a bank holiday), the terminal automatically switches to a backup feed for commodities and equity indices. Official daily reference rates serve as a silent fallback when all primary sources are unavailable.
Delayed ~5min · HH:MM to Live. Non-FX instruments (Gold, WTI, BTC, US 10Y, DXY) update every ~5 min; when the primary feed is detected as frozen, the terminal switches automatically to a backup feed for commodities and equity indices. Click any pair to jump directly to the price chart with that symbol pre-selected.
News ticker
The scrolling headline strip below the quote bar shows the most recent FX-relevant headlines from RSS feeds (FXStreet, ForexLive, Reuters FX, ECB, BoE, BoJ, RBA, RBNZ, BoC, SNB, Norges Bank, Riksbank, Federal Reserve, Investing.com, ForexCrunch, MarketPulse, DailyForex, ActionForex, BabyPips, FX Empire and others), refreshed every hour. The terminal re-checks for new data every 2 minutes. Headlines are color-tagged by currency when a specific pair is mentioned.
AI Narrative & Regime
Immediately below the quote bar in the main panel, the Narrative bar provides a 2–3 sentence summary of current market conditions, synthesized by AI from rate differentials, cross-asset flows, COT positioning, and upcoming macro events.
Next to the narrative text, the Regime label provides a one-word characterization of the overall market environment:
Price Chart
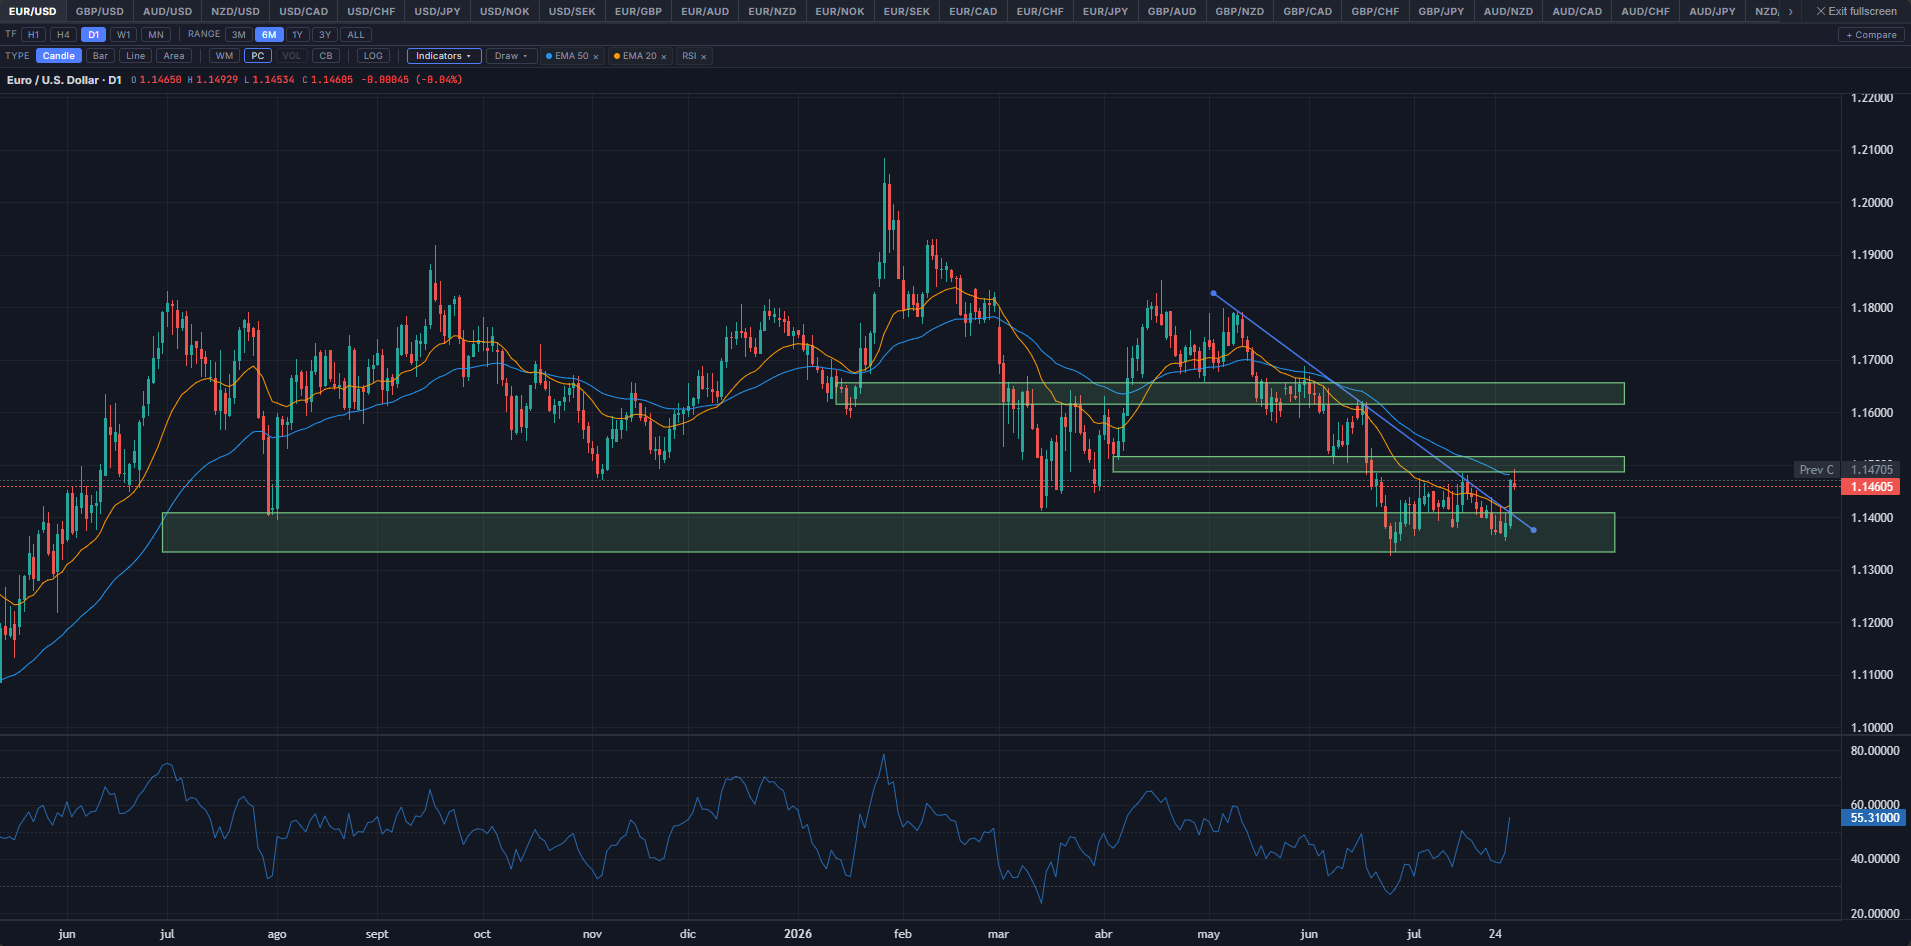
A native price chart — the primary chart for all symbols with OHLC data. 49 instruments are accessible via the tab row above the chart: all G10 FX majors and crosses, Gold, Silver, WTI, Brent, DXY, major equity indices (S&P 500, Nasdaq, Dow Jones, DAX, FTSE 100, Hang Seng, Nikkei, EuroStoxx), BTC/USD, ETH/USD, VIX, and MOVE. For symbols without OHLC data, the chart falls back to an embedded TradingView widget.
The LW chart loads in candlestick mode with a D1 (daily) timeframe and a 3-month default range. The toolbar above the chart gives you full control: timeframe (H1 / H4 / D1 / W1 / MN), chart type (Candle / Bar / Line / Area), range (3M / 6M / 1Y / 3Y / ALL), overlay toggles (WM — symbol watermark; PC — previous close line; VOL — volume histogram; CB — central bank meeting markers), logarithmic scale, a multi-MA selector (periods: 5, 10, 20, 50, 100, 200 — up to three simultaneous MAs), an Indicators menu, a Draw menu, a + Compare overlay, and a fullscreen toggle. The OHLC header updates on hover showing O/H/L/C values and the daily change. For H1/H4, bars are sourced from intraday candles; D1 bars come from daily OHLC history. W1 and MN bars are aggregated from the daily dataset — the current incomplete bar's open, high, and low reflect the full period to date (not just the current session).
Indicators
The Indicators menu adds any of 31 overlays and oscillators, grouped Moving Averages (SMA/EMA/WMA/HMA/DEMA/TEMA/VWMA), Overlays (VWAP, Bollinger Bands, Keltner Channel, Donchian Channel, Parabolic SAR, Ichimoku Cloud, Supertrend, FX Fair Value, Retail Avg Entry, Pivot Points Daily/Weekly/Monthly), Oscillators (RSI, Stochastic, MACD, CCI, Williams %R, ROC, Momentum, MFI, Awesome Oscillator, TRIX, DPO, Ultimate Oscillator), Volatility (ATR, ADX/DMI, Aroon, Choppiness Index), and Volume (OBV, Chaikin Money Flow). Each is independently configurable (period, colors, and other parameters where applicable) and oscillators render in their own sub-pane below the main chart. Settings persist per-browser across symbol switches.
Drawing Tools
The Draw menu offers trend lines, rectangles, and Fibonacci retracements — click to place the first anchor, click again to complete. Selecting a drawing shows resize/move handles and a small floating toolbar (color, delete); Ctrl+C / Ctrl+V (Cmd on Mac) copies and pastes the selected object with a small offset, matching standard chart-object conventions. Drawings can be placed and dragged freely into forward time, past the last candle — useful for projecting trend lines or marking a forward target — and stay pinned to their price/time coordinates as new bars arrive or the chart is resized. Drawings tuck under the price-scale ribbon and time axis rather than rendering on top of them.
Seasonality
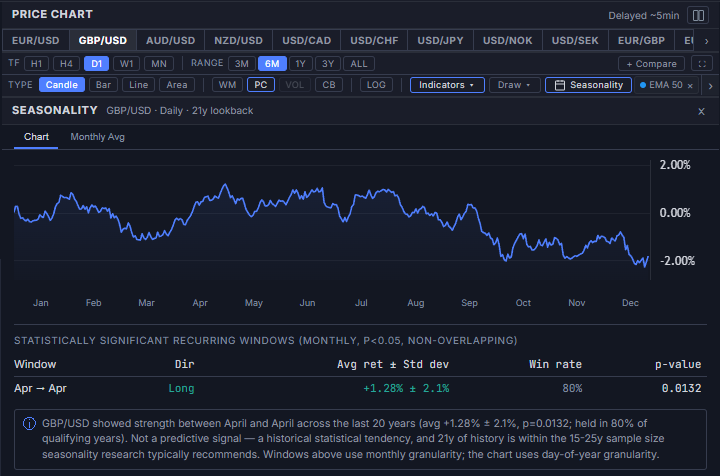
A Seasonality button in the chart toolbar opens a panel showing recurring, calendar-based return patterns for the active pair — fiscal year-end repatriation flows, commodity cycles, tax-payment flows, and similar tendencies that repeat at roughly the same point in the year. It runs entirely on the daily OHLC history the terminal already stores, so no new data source is involved.
Two tabs are available. The Chart tab plots a day-of-year seasonal curve (average cumulative return by calendar day across the full lookback, additive rather than compounded) with a month-label row beneath it, followed by a table of statistically significant recurring windows — monthly-resolution periods that clear a one-sample t-test (H0: the true mean window return is zero) against qualifying years, at p<0.05. Every contiguous 1–12 month window is tested (~78 candidates per pair); a Benjamini-Hochberg False Discovery Rate q-value is also computed across each pair's full candidate set and shown alongside the raw p-value for additional context, matching the reference seasonality tools this panel follows (Seasonax and its Bloomberg Terminal integration, APP SEASONS GO), neither of which apply a multiple-comparisons correction as the display gate. Direction, average return ± standard deviation, and win rate (shown for context only, not used as a gate) round out each row. The Monthly Avg tab shows a simpler, purely descriptive table: average net move per calendar month across the full lookback, laid out with months as columns — this tab is not significance-tested, unlike the Chart tab's windows table.
FX Pairs Table
Below the price chart, the FX Pairs — Majors table shows a snapshot of all major pairs with the following columns:
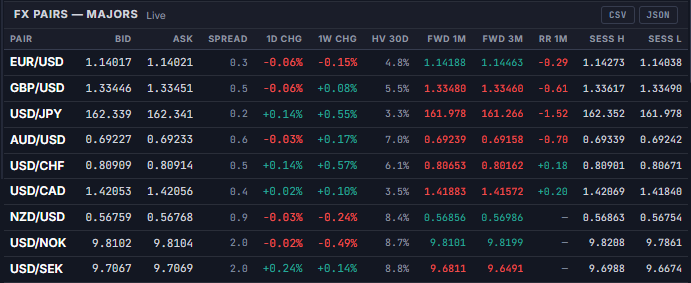
- Pair Currency pair identifier (e.g., EUR/USD)
- Bid / Ask Current bid and ask prices — FX pairs sourced live during market hours; non-FX instruments delayed ~5 min
- Spread Estimated current spread in pips, color-coded (green <1.5 pip, orange 1.5–3, red >3)
- 1D Percentage change vs. yesterday's closing price — updates live during market hours via the same WebSocket feed as Bid/Ask
- 1W Percentage change vs. last week's close — updates on the ~5 min refresh cycle, not by tick
- HV 30d 30-day historical (realized) volatility — annualized standard deviation of daily log returns, computed from daily OHLC data. Not implied volatility.
- Sess H Intraday session high price — updates on the ~5 min refresh cycle, not by tick; a live price briefly exceeding this value catches up at the next refresh.
- Sess L Intraday session low price — same ~5 min refresh cadence as Sess H.
Currency Strength Heatmap
A ranked row of 10 cells — one per G10 currency (USD, EUR, GBP, JPY, AUD, CAD, CHF, NZD, NOK, SEK) — sorted from strongest to weakest. Each cell shows the currency's average percentage change across the pairs that include it, computed from 32 live pairs in total: the 28 classic G8 crosses (each of the 8 majors appears in 7 pairs) plus 4 Scandinavian pairs (USD/NOK, USD/SEK, EUR/NOK, EUR/SEK). NOK and SEK are therefore each averaged across only 2 pairs rather than 7 — a thinner, noisier read than the eight majors, reflecting NOK/SEK's narrower direct cross-pair coverage rather than a data quality issue.

Strength is computed across 32 live pairs: the classic 28-pair combination of the 8 G8 majors (8×7÷2 = 28, each currency appearing in exactly 7 pairs) plus 4 added Scandinavian pairs (USD/NOK, USD/SEK, EUR/NOK, EUR/SEK) to bring NOK and SEK into the same heatmap. When market is open, each currency's score updates in real time; during off-hours delayed data (~5 min) provides the baseline. For example, JPY's score averages its move in USD/JPY, EUR/JPY, GBP/JPY, AUD/JPY, NZD/JPY, CAD/JPY and CHF/JPY — a true 7-pair basket reading. NOK and SEK, having no direct cross-pairs against GBP, AUD, CAD, CHF, or NZD, average only their 2 available pairs each (vs. USD and vs. EUR) — a valid but thinner read than the 8 majors. ECB daily rates serve as a silent fallback only when RT data is unavailable. Cells are color-coded by intensity: dark green (strong), light green (mild), flat (near zero), light red (mild weakness), dark red (weak).
Currency Detail Modal
Clicking any cell in the heatmap opens a full-screen detail modal for that currency. The modal organizes data into four tabs:
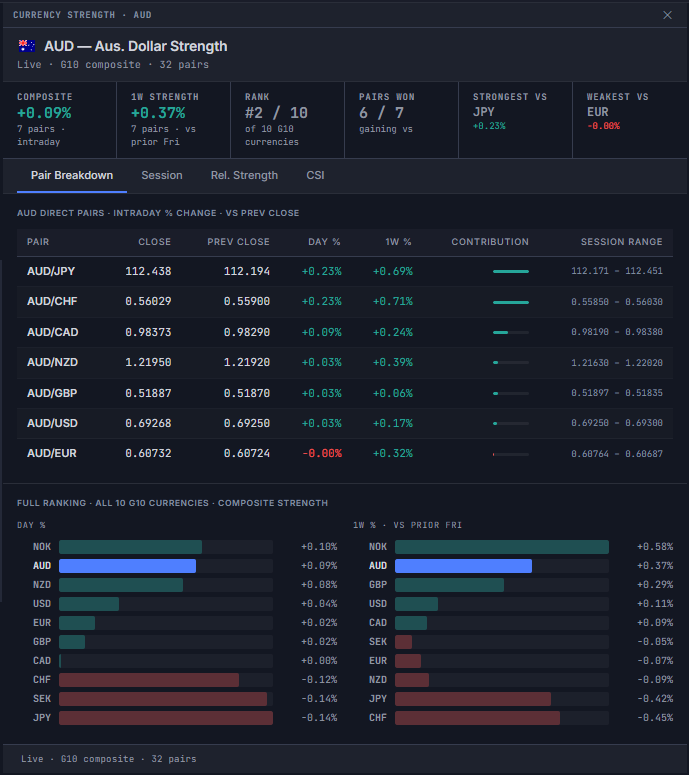
Pair Breakdown — shows the direct pairs for the selected currency (7 for the 8 G8 majors; 2 for NOK and SEK) with close price, previous close, percentage change, day % and 1W %, and a proportional impact bar. A composite ranking row shows the full 10-currency strength order with animated horizontal bars. The metrics strip above the table shows six tiles: Composite (intraday), 1W Strength, Rank, Pairs won, Strongest vs, and Weakest vs.
Session — shows the selected currency's strength contribution weighted by trading session volume (New York 38%, London 35%, Tokyo 18%, Sydney 9%). The active session is highlighted in blue. Below the session bars, an AI Session Context block provides per-session notes for the currency: a concise recap of the catalyst that drove price action in each session (CLOSED), current session dynamics (ACTIVE), and the upcoming scheduled event to watch (UPCOMING). Session context notes are generated 4× daily alongside the main narrative and are grounded in actual economic calendar events. All displayed times are converted to your local timezone.
Rel. Strength — shows a 10×10 strength differential matrix with a Composite column: each cell is the composite % difference between the row currency and the column currency, with color intensity proportional to the divergence. Below the matrix, a Strength Drivers block lists the top 3 pairs by absolute contribution, each with an AI-generated one-line note (max 85 characters) explaining the structural driver — CB stance differential, COT positioning extreme, or carry differential. Attribution footer: AI Analytics · ~5min delay.
CSI — Currency Strength Index: a multi-series LightweightCharts chart showing the cumulative log-return of all 10 G10 currencies over selectable periods (1M / 3M / 6M / 1Y / All). Computed from the full OHLC dataset across all 32 pairs — the same data as the heatmap. The focal currency's line is highlighted; all series start at 0% at the beginning of the selected period. A crosshair tooltip shows all 10 values simultaneously ordered strongest to weakest. A legend table below shows cumulative return, min, max, and range for each currency over the period.
Left Sidebar
FX Liquidity
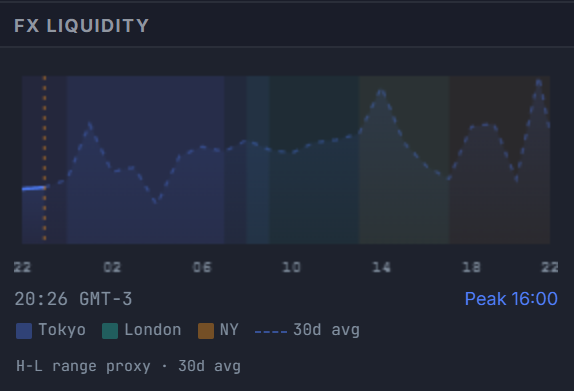
A canvas-drawn chart showing estimated FX market liquidity across the 24-hour trading day. The curve peaks at London–New York overlap (~13:00–17:00 UTC), which historically accounts for the highest volume and tightest spreads. A vertical orange line marks the current UTC time — everything to its left is scaled to today's actual volatility; everything to its right is a historical projection. A small source label below the legend shows the active data source (Delayed ~5min · H-L range proxy · 30d avg when live data is available, Historical avg · fixed reference as fallback). See the dedicated FX Liquidity & Sessions guide for a full explanation.
Crosses
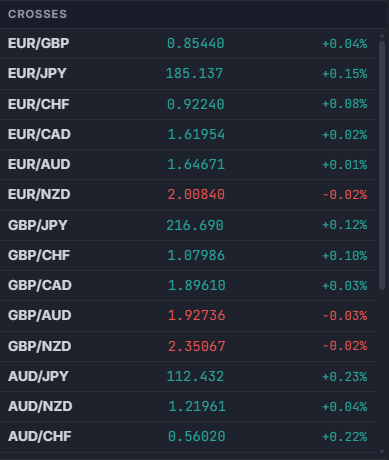
Live prices and daily percentage changes for 23 cross pairs, ordered by standard ISO currency hierarchy. EUR group: EUR/GBP, EUR/JPY, EUR/CHF, EUR/CAD, EUR/AUD, EUR/NZD, EUR/NOK, EUR/SEK. GBP group: GBP/JPY, GBP/CHF, GBP/CAD, GBP/AUD, GBP/NZD. AUD group: AUD/JPY, AUD/NZD, AUD/CHF, AUD/CAD. NZD group: NZD/JPY, NZD/CAD, NZD/CHF. CAD group: CAD/JPY, CAD/CHF. CHF group: CHF/JPY. Click any cross to open it in the price chart and expand its inline detail strip — the same data card available in the FX Pairs table (Price · Volatility · COT Positioning · Retail Sentiment). Click the same row again to collapse it. Cross pairs often reveal currency-specific stories that major pairs obscure.
Carry Trade — Top Pairs
A ranked list of the top 10 carry trade pair candidates across all 45 G10 currency combinations, sorted by real carry — the nominal OIS rate differential minus the inflation expectations differential between the two legs. This equals the real rate of the long leg minus the real rate of the short leg, and is the primary metric used by institutional FX carry screens. The tiebreak is carry-to-vol: real carry divided by 30-day realised volatility (HV30), filtering for efficiency of return per unit of risk. When inflation expectations data is unavailable, the panel falls back to gross nominal differential ranking and the subtitle updates to reflect this.
Each row shows: the rank, the pair, the nominal OIS spread as context (e.g. +2.83%), a proportional bar, and the real carry value on the right (what actually ranks the pair). A positive real carry means the long leg earns positive carry after inflation erodes the nominal spread. Clicking any row opens the Real Rate Carry Modal for a full breakdown. Hovering shows: long rate / short rate / real carry / HV30.
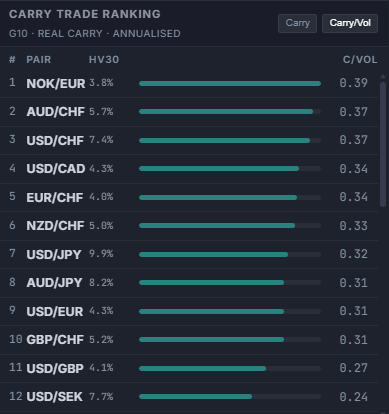
The right column shows real carry (nominal OIS spread minus inflation differential) — the primary ranking value. The middle column shows the nominal OIS spread as reference context. Color coding: green = real carry ≥+0.5% (positive after inflation), neutral = 0%–0.5%, dim = negative real carry (inflation erodes nominal spread). Note: this is inflation-adjusted carry, not Covered Interest Parity (CIP) — no FX forward adjustment is applied.
Volatility Leaderboard
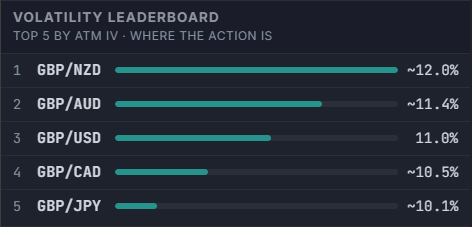
Ranks all 28 G10 pairs by current ATM implied volatility and shows the top 5 — the pairs where the options market is currently pricing the most movement, independent of which pair you habitually watch. The 6 USD majors are sourced directly from an institutional-grade options market (CBOE/CME FX Volatility Index, PHLX World Currency Options, Saxo Bank, or CME futures/ETF, whichever is live for that pair); the 21 cross pairs are triangulated from their two component majors' implied vol and an estimated correlation. NOK and SEK are excluded — no CBOE/CME volatility index exists for either, and no institutional-grade free substitute is available.
Each row shows: rank, pair, a magnitude bar scaled to this group's own spread (not a fixed 0–100 scale, so the real gap between the top 5 is visible at a glance), and the ATM IV value. A ~ prefix marks a triangulated cross value rather than a direct market quote. Hovering a row shows IV Rank — the percentile against the pair's own 52-week range — shown for context only, since this panel already selects for "currently high," not for "cheap vs. expensive." Hovering the panel header shows the full ranking methodology as a tooltip.
Economic Calendar
A native Economic Calendar panel in the main content column, showing G10 medium- and high-impact events, dual-sourced across two independent calendar feeds for redundancy and faster prints on releases. The panel subtitle states scope only — G10 currencies · medium & high impact — without naming the underlying data vendor, consistent with how institutional terminals label their calendar panels. Columns: local time (your browser timezone, labeled once in the column header — e.g. "GMT-3" — not repeated elsewhere), currency flag, impact dot (red = high, orange = medium), event name, actual result with beat/miss coloring, consensus forecast, and previous reading. Beat/miss direction correctly inverts for indicators where a lower print is the positive outcome (e.g. Unemployment Rate, Unemployed Persons). The panel auto-scrolls to today or the next upcoming event on load. A floating pill button appears when upcoming events are off-screen, with an adaptive arrow pointing toward them.
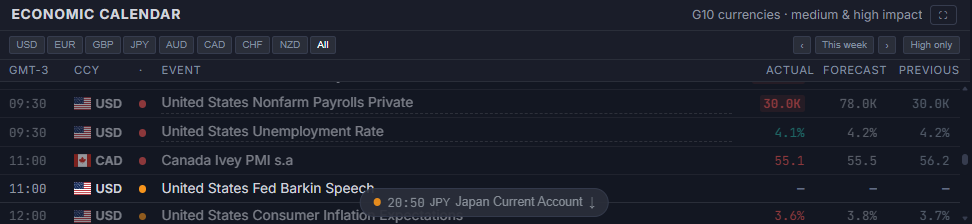
The single soonest unreleased high-impact event due within the next 3 hours gets a highlighted row, with its clock time replaced by a live countdown that ticks independently of the panel's regular data refresh; inside the final 15 minutes the row switches to a stronger pulsing highlight. Hovering the countdown still shows the actual scheduled local time.
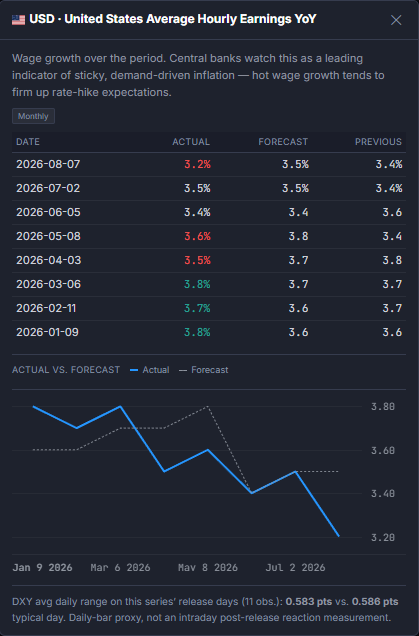
Hovering an event title with a dashed underline opens a methodology tooltip explaining what that release measures and why FX desks watch it (covers the standard G10 headline releases — NFP, CPI, rate decisions, PMIs, and similar). Clicking any event title opens a detail modal with an actual-vs-forecast history chart over the trailing prints, the next scheduled release date with consensus forecast, and a scrollable release history table. When a released event's Previous value has since been revised from what was originally recorded, a small superscript "R" appears next to it with a tooltip showing the old value → the revised one. Actual/forecast surprise coloring is tiered by magnitude (mild / moderate / strong relative deviation) rather than a flat beat/miss binary.
A currency filter — the G10 flags at the right edge of the column header — isolates the calendar to a single currency; click again (or "All") to restore the full G10 set. The filter persists across sessions via local storage.
On bank holidays, one or more dedicated holiday rows appear at the top of the affected day — one row per market closure. Each row shows the currency flag, 3-letter code (e.g. 🇺🇸 USD), the holiday title (e.g. "Memorial Day"), and "All Day" in the time column. A tooltip on hover shows the full label: "Memorial Day — USD market closed". This makes it immediately visible why quotes for Gold, SPX, WTI, and USD pairs may be frozen on those days.
Pair Detail
Clicking any pair in the FX Pairs table or any cross in the sidebar opens the Pair Detail panel, docked directly below the Price Chart. It updates instantly on every click with no page reload — click the same row again, or the panel's own collapse chevron, to close it. The panel subtitle always shows the currently selected pair. Content is split across five tabs — Overview · Macro Drivers · Session Context · Strength Drivers · Fair Value — so a single click gives you both the pair's live metrics and the AI-written narrative context behind them:
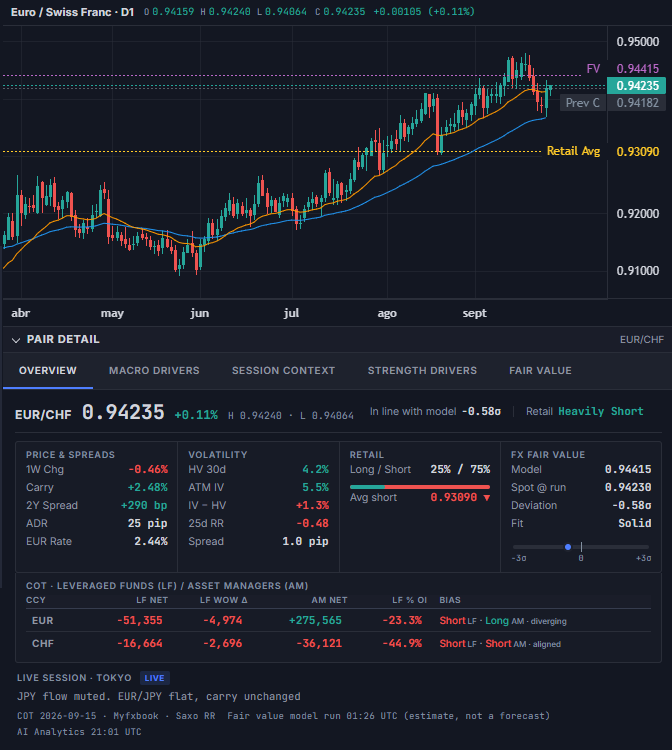
The five tabs:
- Overview The default tab. A hero row (live price, daily % change, session H/L) with two badges when available — deviation from the Fair Value model (e.g. In line with model −0.58σ) and retail positioning skew (e.g. Retail Heavily Short). Below it, four metric groups: Price & Spreads (1W change, carry differential, 2Y/10Y sovereign spread, ADR in pips, base-currency policy rate), Volatility (HV 30d, ATM IV, IV−HV, 25d Risk Reversal, bid-ask spread), Retail (long/short % split with a bar, average long/short entry price), and FX Fair Value (model value, spot at last run, deviation in σ, and fit quality). Underneath, a COT · Leveraged Funds/Asset Managers table (one row per currency leg — two rows for cross pairs) and a live-session box naming the currently open session and a short flow note for it.
- Macro Drivers AI-written narrative on what's currently driving each leg of the pair, with a toggle to switch between the base and quote currency. Regenerated on every daily run regardless of whether the market is open, since it describes macro narrative that stays valid through the weekend.
- Session Context All four FX trading sessions — Sydney, Tokyo, London, New York — each flagged Live, Closed, or (with a countdown) opening soon, alongside a short note on that pair's typical flow during the currently live session.
- Strength Drivers The structural read behind each currency's strength — COT positioning, central bank stance, OIS-implied bias. Only regenerated when its underlying inputs change or after its staleness window elapses, so it can lag Macro Drivers by up to a day.
- Fair Value The full model behind the Overview tab's FX Fair Value card: spot, model fair value, deviation in standard deviations on a −3σ/+3σ gauge, the rate differential input, and whether the fit is Solid (the regression solves directly) or Regularized (ridge fallback where the regressors are too collinear to identify directly — still a valid fit, just less directly identified).
Right Panel
Central Bank Rates
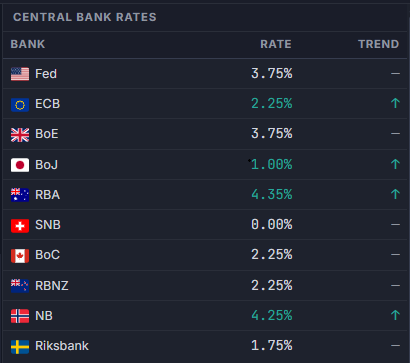
Current policy rates for all ten G10 central banks (Fed, ECB, BoE, BoJ, RBA, BoC, SNB, RBNZ, Norges Bank, Riksbank), updated daily from official CB sources. The trend column shows the direction of the most recent rate cycle: ↑ Hiking, ↓ Cutting, or — Hold. The trend resets to neutral (—) after approximately 90 days without a policy move — regardless of the prior cycle direction.
Key Correlations
Rolling Pearson correlations between 12 FX-relevant pairs and reference assets, computed from daily OHLC data. Three lookback windows are available — 30d, 60d, and 90d — selectable via the buttons in the panel header (60d is the default). The table includes a vs norm column showing how far the current 30d correlation deviates from its 252-day historical baseline, expressed as a z-score. The baseline is the mean of all rolling 30-day Pearson windows over the past 252 trading days — keeping the norm horizon consistent with the current correlation regardless of which display window (30d/60d/90d) is selected. Pairs deviating more than 1.5σ from their historical norm are flagged as stretched; above 2.5σ as a break — a broken correlation is often as informative as the correlation itself. Clicking any row opens a detail modal with a 252-day sparkline on real calendar dates, z-score, 30d/60d/90d snapshots, and a regime signal indicator.
Two pairs monitor macro regime specifically: DXY vs SPX (normally negative — a positive reading signals USD funding stress) and Gold vs DXY (normally negative — a positive reading signals the safe-haven model is broken or inflation is driving both).
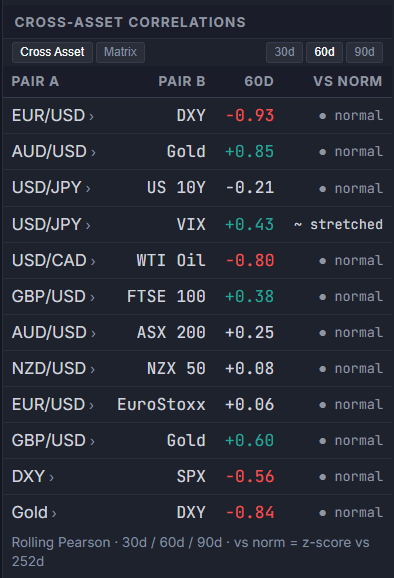
A second tab, Matrix, switches the panel from the pair list above to a 10×10 G10 currency correlation grid — each cell is the Pearson correlation between two currencies' composite returns (not a single pair's raw returns), computed over the same 30d/60d/90d window selected for the Cross Asset tab above (the two tabs share one window selector). Diagonal cells show a placeholder rather than a meaningless 1.00. Hovering any cell highlights both its row and column header, making it clear at a glance which two currencies a given reading belongs to.
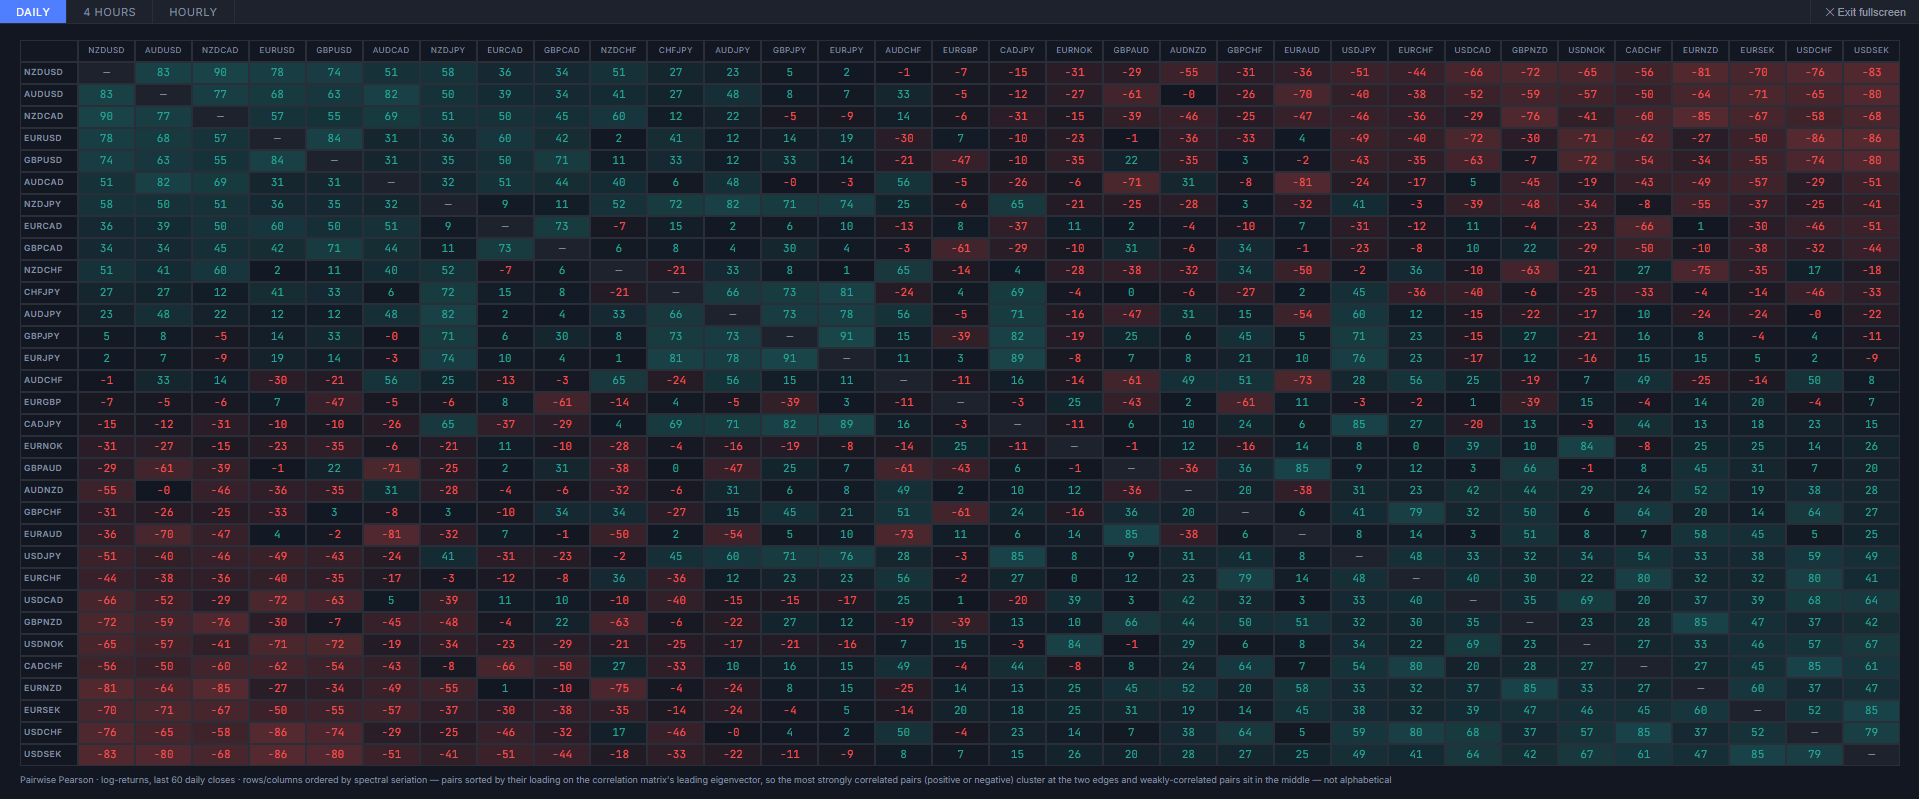
A ⛶ button in the Matrix tab's header expands it to a full-screen, separate matrix covering all 32 G10 FX pairs against each other (pairs, not currencies), selectable across three timeframes — Daily, 4 Hours, and Hourly. Rather than an alphabetical grid, rows and columns are ordered by spectral clustering — pairs are sorted by their loading on the correlation matrix's leading eigenvector, so strongly correlated pairs (positive or negative) group together at the two edges and weakly-correlated pairs sit in the middle. Press Esc or the Exit fullscreen button to return to the docked panel.
On the Daily tab only, hovering a row or column header also surfaces a 2Y Diff factor tag: the Pearson correlation between that pair's own daily FX return and the day-over-day change in its 2Y-vs-2Y yield spread (base currency minus quote currency), sourced from the same daily 2Y history used by the Rates & Yield Curve panel's Momentum tab. This factor isn't computed on the 4H/Hourly tabs, since the underlying 2Y data is daily-only. Most pairs still show as accumulating history rather than a correlation figure while that daily series builds up.
CB Rate Expectations
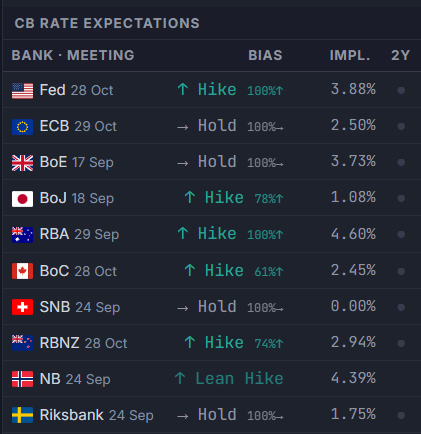
Forward-looking rate expectations for all ten G10 central banks at their next scheduled meeting, sourced from OIS (Overnight Index Swap) and futures market pricing — not analyst forecasts, not editorial opinion. This panel is distinct from the CB Rates table above it: the CB Rates table shows what the rate is today; this panel shows what the market expects the rate to become at the next meeting. FX reacts to expectations, not to the current rate — which is why this signal matters at the margin.
Each Bias field is computed from the overnight rate market specific to that currency:
| Currency | OIS Instrument | Source |
|---|---|---|
| USD | SOFR futures (ZQ) | CME FedWatch |
| EUR | ESTER overnight (+7bp DFR normalisation) | ECB Statistical Data Warehouse |
| GBP | SONIA overnight | Bank of England public database |
| JPY | TONA overnight | Bank of Japan daily CSV |
| AUD | 30-day IB cash rate futures | ASX Rate Indicator |
| CAD | CORRA overnight | Bank of Canada Valet API |
| CHF | SARON overnight | SNB data portal |
| NZD | OCR interbank overnight (HB2) | RBNZ daily CSV |
| NOK | NOWA overnight | Norges Bank data portal |
| SEK | SWESTR overnight | Riksbank data portal |
Classification: if the OIS/overnight rate is more than 10bp below the current policy rate → ↓ Cut; more than 10bp above → ↑ Hike; within ±10bp → → Hold. The label is prefixed with ~ when the OIS source is unavailable and the terminal falls back to estimating from historical rate trajectory. When market-implied probabilities are available for any of the ten banks, a small chip appears next to the Bias showing the probability of the expected move: 24%↓ for cut bias or 45%↑ for hike bias. Cut chips are color-coded red (≥60%), neutral (40–59%), or muted (<40%); hike chips follow the same thresholds in green.
A fourth column, 2Y, cross-checks that OIS-implied bias against the currency's own 2Y sovereign yield: a gray dot (●) means the 2Y's 5-day move agrees with what OIS has priced in; an orange arrow (▲/▼) flags a 2Y move that is both statistically unusual versus the rest of the G10 (z-score gate) and running against the OIS-implied direction — an early divergence signal, since the 2Y can move ahead of a repricing in spot. The cell is blank while a currency is still accumulating enough daily 2Y history to compute the z-score.
Economic Surprises
An ESI (Economic Surprise Index) centred bar chart, modeled on the Citigroup CESI and Bloomberg BEEI methodology, showing whether each major currency’s macro data is beating or missing consensus forecasts over a rolling 90-day window. The panel scores medium- and high-impact calendar releases only — low-impact events and non-macro noise (auctions, inventory data, financial flows) are excluded to match the methodology of institutional surprise indices.
The bar is centred at zero: a green bar extending right means data is beating consensus on net; a red bar extending left means data is missing. The N column shows how many events with actuals are in the current window — entries with fewer than 15 events are dimmed to flag low statistical confidence.
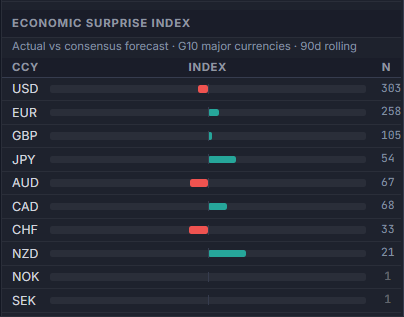
How to read the index: an event where actual exceeds consensus counts as a beat (+1), below consensus as a miss (−1), equal as in-line (0). Index = (beats − misses) / total scored × 100, ranging from −100 (all misses) to +100 (all beats). This is the same beat/miss approach used as the basis of institutional economic surprise indices (Citi CESI and equivalents) before they apply their proprietary weighting. As 12–24 months of history accumulate, the panel upgrades each event to a z-score (actual − forecast relative to historical standard deviation), providing a magnitude-weighted signal that matches the full institutional index methodology.
Hover any row for a detailed breakdown: beat count, miss count, in-line count, beat rate, and current index value. COT-derived directional bias is covered separately in the dedicated COT / CFTC Positioning guide; options-market data — 25-delta Risk Reversal term structure, realized volatility, and CIP-implied forwards — lives in the Derivatives tab, covered in full under Derivatives below.
Attribution: Myfxbook · actual vs consensus · 90d rolling
News Feed
The News tab in the topbar (keyboard shortcut: N) opens the dedicated News Feed panel, replacing the main content area — the same pattern as the Derivatives section. It shows FX-relevant headlines from FXStreet, ForexLive, Reuters FX, ECB, BoE, BoJ, RBA, RBNZ, BoC, SNB, Norges Bank, Riksbank, Federal Reserve, Marc to Market and others, sorted by estimated market impact. The feed refreshes hourly; the terminal re-checks for new data every 2 minutes using HTTP ETags — no bandwidth cost when there are no changes.
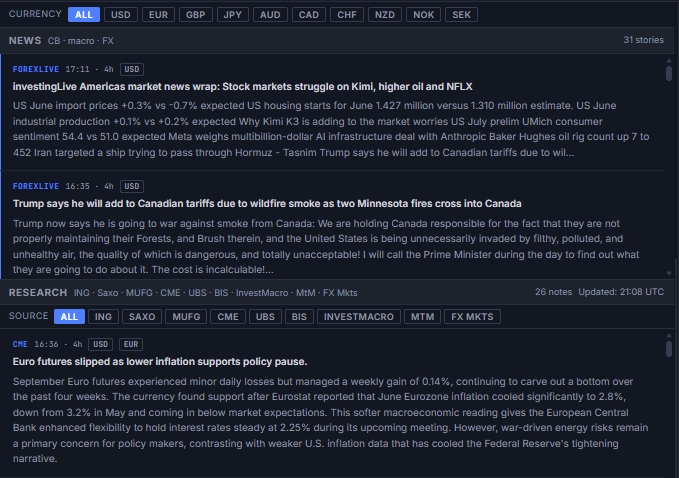
Each row shows: the publication time with a relative age indicator below it, an impact dot (red = high, amber = medium, grey = low), the headline truncated to one line, and the currency tag for the pair most likely affected. Hovering over any row shows the complete headline in a native tooltip. Click a row to expand an accordion drawer with the full snippet, source name, and a link to the original article — only one item can be expanded at a time.
The filter bar at the top lets you narrow the feed by currency (All / USD / EUR / GBP / JPY / AUD / CAD / CHF / NZD) or by impact (All / High / Med). Filters apply instantly in memory without re-fetching.
Alerts & Market Signals
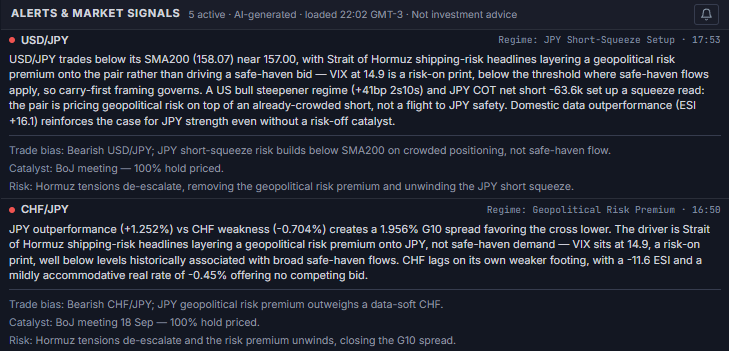
The final section of the main panel shows AI-generated market signals, updated 4× daily alongside the narrative (00:00, 06:30, 14:30, 20:00 UTC), plus an extra Friday 22:30 UTC refresh once the week's COT report is in. Each structured signal card shows:
- Priority dot — a colored indicator: red = critical, amber = warning, blue = informational
- Pair & badge — the pair and a short regime/setup label (e.g. "EUR/USD — Crowded Long"), with the update timestamp alongside it, converted to your local timezone
- Body — the cross-referencing rationale: rate differentials, COT positioning, and price action tying the setup together
- Trade bias / Catalyst / Risk — a mandatory three-line footer closing every signal, matching the structure institutional desk notes use: the current stance, the event that could move it, and the condition that would invalidate it. These are descriptive of market conditions, never an instruction to take a specific action.
A small minority of signals — the weekend pre-open format — use a shorter, compressed 2–3 sentence read without the Trade bias/Catalyst/Risk footer; these fall back to a plain single-paragraph card with the priority dot, timestamp, title, and text laid out in one line.
Signal Notifications
A bell icon button in the panel header lets you opt into browser notifications for new AI signals. When enabled, the button turns blue and the browser will notify you each time the signal set updates with new content — one notification per update cycle, summarising the count by priority. The preference is saved in your browser's local storage. To disable, click the bell again. If your browser has blocked notifications for this site, the button shows a red "blocked" state — re-enable notifications in your browser's site settings to use this feature.
Price & Advanced Alerts
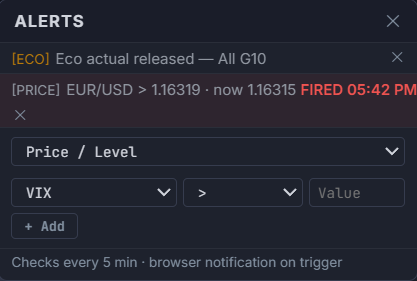
Configurable alerts are available via the alerts button in the status bar at the bottom of the screen. An alert type selector lets you choose from ten categories:
| Type | What it monitors | Instruments |
|---|---|---|
| Price / Level | Fires when a price or index crosses a threshold (above or below) | VIX, EUR/USD, USD/JPY, GBP/USD, AUD/USD, USD/CHF, USD/CAD, NZD/USD, Gold, WTI, DXY, SPX, BTC, US 10Y, MOVE |
| Economic actual released | Fires as soon as a new economic-calendar actual is published for the selected currency filter, same-day | All 10 G10 currencies, individually or in common pairs (e.g. USD + EUR) |
| HV30 vs IV spread | Fires when the gap between realised (HV30) and implied (IV) volatility crosses a threshold — useful for identifying options mispricing | EUR/USD, GBP/USD, USD/JPY, AUD/USD |
| IV Rank | Fires when the current implied volatility percentile rank crosses a threshold (0–100 scale) — helps identify historically cheap or expensive options. The same IV Rank value also colors the ATM IV metric on price-detail cards and its own column in the Volatility Leaderboard | EUR/USD, GBP/USD, USD/JPY, AUD/USD |
| Correlation Z-score | Fires when a correlation deviates from its 252-day norm beyond a z-score threshold — signals potential regime breaks | All 12 correlation pairs (EUR/USD vs DXY, AUD/USD vs Gold, etc.) |
| VaR 95% (1d) | Fires when the 1-day historical VaR at 95% confidence for an instrument exceeds a threshold — signals elevated tail risk | EUR/USD, USD/JPY, GBP/USD, AUD/USD, Gold, WTI, SPX, BTC |
| 25d Risk Reversal | Fires when the 1-month 25-delta risk reversal crosses a threshold — positive = call skew (market pays up for upside), negative = put skew (downside hedging demand) | EUR/USD, GBP/USD, USD/JPY, AUD/USD, USD/CHF, USD/CAD |
| COT Positioning Rank | Fires when Leveraged Funds' net position, ranked against its own trailing 52-week range (0–100), crosses a threshold — same methodology as the COT Full Breakdown panel's Net Exposure % Rank chart | EUR, GBP, JPY, AUD, CAD, CHF, NZD |
| FX Fair Value Z-score | Fires when the FX Fair Value model's Z-score crosses a threshold — |Z| > 1 signals spot trading away from the model's estimate | EUR/USD, GBP/USD, USD/JPY, AUD/USD, USD/CHF, USD/CAD, NZD/USD |
| Regime change | Fires when the live stress score triggers a transition to a specific regime label | RISK-OFF, CAUTION, MIXED, RISK-ON |
Economic-actual alerts check every 30 seconds — the calendar data itself typically refreshes end-to-end within 2–3 minutes of a real release. All other alert types check every 5 minutes. All alerts persist across sessions in local storage. On trigger, an alert fires three layers at once: an in-terminal toast in the corner of the screen, an entry in the bell icon's history tray (with an optional short chime, toggled via the speaker icon next to the bell), and — if you've granted permission — a browser notification. Click the alert row in the popover to delete it. If your browser has blocked notifications, the alerts button shows a red state — re-enable from your browser's site settings; the in-terminal toast/tray layer works regardless of that permission.
Derivatives
The Derivatives section is accessible via the topbar navigation tab (keyboard shortcut: D). It is hidden by default and replaces the main content area when selected. It consolidates five derivative and reference data panels not found elsewhere in the terminal.
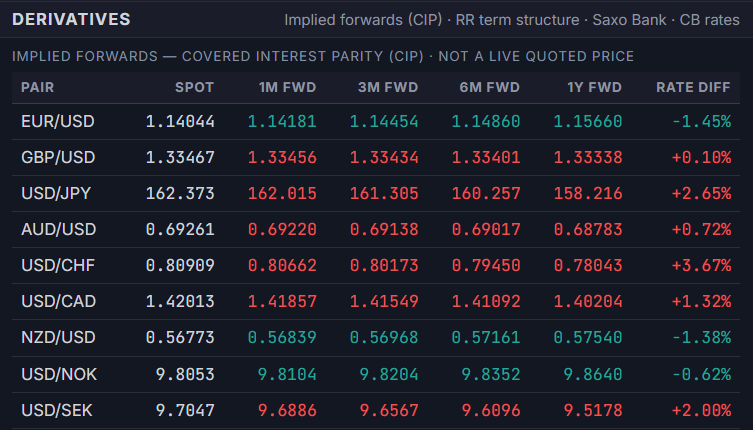
Implied Forwards — Covered Interest Parity (CIP)
Shows the theoretically fair forward rate for G10 major and cross pairs at four tenors (1M, 3M, 6M, 1Y), computed using the Covered Interest Parity formula: F = S × (1 + r_left × T) / (1 + r_right × T). The overnight benchmark rates (SOFR for USD, €STR for EUR, SONIA for GBP, TONA for JPY, AONIA for AUD, CORRA for CAD, SARON for CHF, OCR overnight for NZD) are used as discount rates — not the CB policy rates — for the 8 G8 majors. NOK and SEK pairs (USD/NOK, USD/SEK, EUR/NOK, EUR/SEK) use the Norges Bank and Riksbank policy rate as a fallback where a dedicated daily overnight benchmark is not yet wired in. This is the same methodology used by institutional FX desks for CIP pricing.
The Rate Diff column shows the annualized differential between the left-hand and right-hand currency's overnight benchmark. A positive value means the base currency is at a forward discount — the left-hand currency's interest rate is higher, so the forward rate is below spot per CIP. These are not live quoted prices — they are theoretical fair-value estimates based on OIS benchmarks and the current spot rate. Actual market forward prices incorporate credit, liquidity, and balance sheet premia.
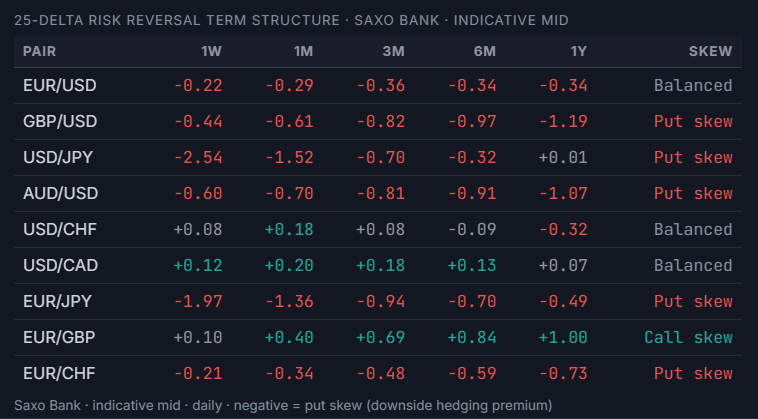
25-Delta Risk Reversal Term Structure
The Risk Reversal table shows the 25-delta options skew for six major pairs (EUR/USD, GBP/USD, USD/JPY, AUD/USD, USD/CHF, USD/CAD) across five tenors (1W, 1M, 3M, 6M, 1Y). Data is sourced from Saxo Bank — indicative mid-market prices, updated daily.
A negative RR value means put skew — the market is paying a premium for downside protection on the base currency. A positive value means call skew — upside hedging demand dominates. The Skew column summarizes the directional lean across the curve. These figures are a raw indication of options market sentiment at each tenor; they do not represent bid/ask quotes and should not be used directly to price options.
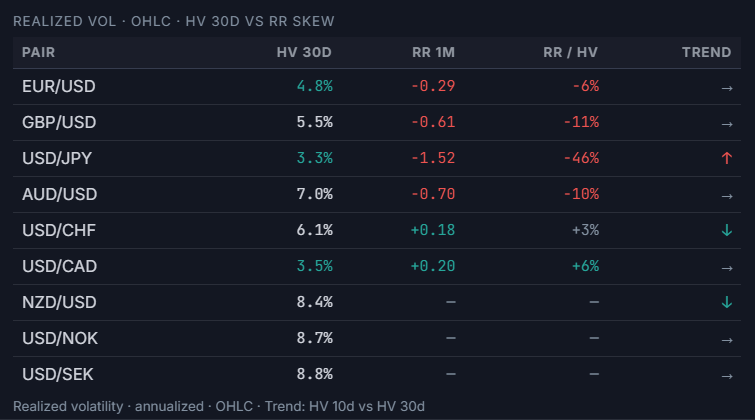
Realized Volatility — HV 30d vs RR Skew
Shows the 30-day historical (realized) volatility for six pairs, computed from daily OHLC data using the standard deviation of log returns annualized (×√252). Columns include:
- HV 30d — annualized realized volatility over the past 30 trading days.
- RR 1M — the 25d Risk Reversal at the 1-month tenor from Saxo Bank.
- RR / HV — the Risk Reversal expressed as a percentage of HV 30d. A large ratio means the options market is implying significant directional skew relative to actual observed volatility — a potential signal of crowded positioning or anticipated event risk.
- Trend — compares HV 10d vs HV 30d: ↑ = short-term vol expanding (HV 10d > HV 30d by more than 1pp), ↓ = contracting, → = neutral.
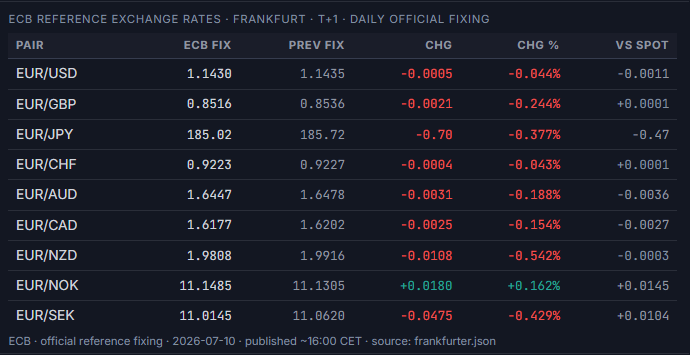
ECB Reference Exchange Rates
The ECB publishes official daily reference exchange rates for all major currency pairs against EUR, typically around 16:00 CET. This panel shows the official fixing for nine EUR-base pairs (EUR/USD, EUR/GBP, EUR/JPY, EUR/CHF, EUR/AUD, EUR/CAD, EUR/NZD, EUR/NOK, EUR/SEK) alongside the previous day's fix, the day-over-day change, and the offset between the current spot rate and the official fixing.
The ECB fixing is the industry standard reference rate used in FX contracts, derivative valuations, and regulatory reporting. It differs from interbank mid prices — use the vs Spot column to see how far the live market has moved from the official reference. Data is sourced from the ECB reference rate cache, updated daily after ~16:00 CET (T+1 settlement basis).
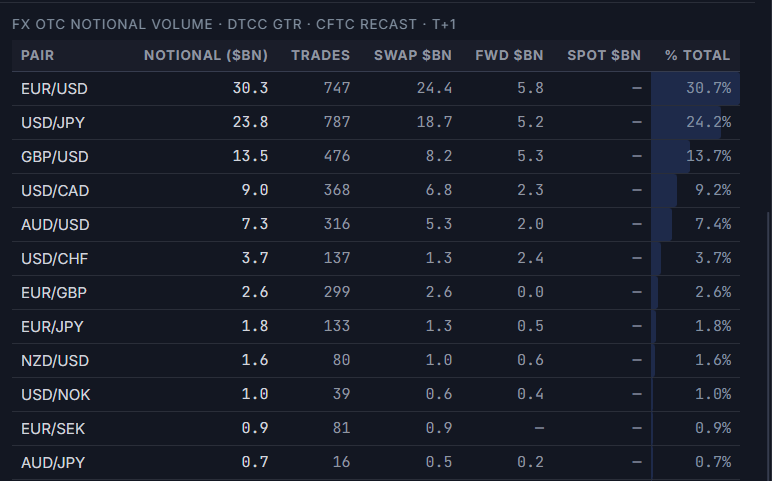
FX OTC Notional Volume — DTCC GTR
Shows aggregated FX OTC notional volume from the DTCC Global Trade Repository, the largest trade repository for OTC derivatives in the US under Dodd-Frank reporting obligations. Data is the public CFTC Recast dissemination — T+1 (published by ~13:00 UTC the following business day), covering new trades only (ACTION = NEWT). Amendments, terminations, and lifecycle events are excluded to avoid double-counting.
Columns shown: Notional ($bn) — USD-equivalent notional, capped at $250M per trade per CFTC Dodd-Frank rules; Trades — count of new trade records; Swap $bn / Fwd $bn / Spot $bn — product-type breakdown where available (product type is derived from the UPI FISN field); % Total — each pair's share of the G10 aggregate, with a proportional intensity bar (standard terminal convention for volume data — directionally neutral, so blue intensity rather than green/red).
G10 live rates, AI market narrative, COT positioning, yield curve, cross-asset risk, and session liquidity — all in one professional dashboard. Available on the web terminal and natively inside MetaTrader 5 through the companion Expert Advisor — both unlock under a single EA rental on MQL5 Market.
Frequently Asked Questions
What panels does the FX Terminal dashboard include?
The terminal is a split-layout dashboard combining a live price chart with drawing tools and indicators, an AI-generated market narrative and regime read, a real-time FX pairs table, a currency strength heatmap, an economic calendar, and a left sidebar covering FX liquidity, currency crosses, carry trade rankings, and a volatility leaderboard — all on one screen, no tab-switching required.
Can the layout be resized or customized?
Yes. The split layout supports resizable panels via drag handles, and the sidebar sections can be collapsed or expanded independently, so a trader can prioritize screen space for the price chart, the currency heatmap, or the sidebar modules depending on their workflow.
What does the AI Narrative panel show?
The AI Narrative panel generates a plain-language market regime read from the terminal's own live data feeds — positioning, rates, volatility, and cross-asset signals — refreshed on a scheduled cadence. It is descriptive market context, not investment advice or a trade recommendation.
Is the FX Terminal dashboard free to use?
Access to the full terminal is provided through a verified broker account with one of the platform's partner brokers, or through the standalone MT5 Expert Advisor rental on MQL5 Market. See the Access page for current coverage and setup steps.