
Cross-Asset Risk Monitor
FX prices don't move in isolation. Equity volatility, bond market stress, commodity prices, and capital flows across asset classes all drive currency pairs in real time. The Cross-Asset and Risk Monitor sections give you a unified view of these intermarket forces.
What It Shows
The terminal combines two adjacent panels — Cross-Asset and Risk Monitor — that together answer the core intermarket question: is risk appetite expanding or contracting right now, and what does that mean for FX?
These are not FX prices. They are the broader market context that explains why FX pairs are moving. A professional FX analyst always monitors these in parallel with the price chart — they are the macro backdrop, not an afterthought.
This is cross-asset volatility and cross-asset risk analysis in practice: reading equities, rates, credit, and commodities together instead of FX in isolation, then running that read through the historical VaR/CVaR table below as a scenario analysis of how the current pair would have performed in past stress episodes.
Cross-Asset Panel
Eight instruments displaying their latest price and daily percentage change. Each cell is clickable — clicking any instrument opens it directly in the price chart (S&P 500, Gold Futures, WTI Futures, BTC/USD, Nikkei 225, EUR Stoxx 50, DXY Index, US 10Y Yield).
Risk Monitor — Overview
Illustrative values above — the live panel updates in real time. Note the HY OAS 20d Δ and the HY/IG OAS levels can point in different directions at once (a spread can be historically tight in level terms while actively widening in direction), which is exactly why both the level and the 20-day change are shown separately rather than collapsed into one number.
The Risk Monitor panel shows three volatility gauges plus five derived indicators that, together, characterize the type and severity of market stress (if any). Understanding all simultaneously is more valuable than reading any one in isolation. The VIX, MOVE Index, US HY OAS, and US IG OAS tiles are each clickable — clicking one opens its chart directly.
The two correlation rows at the bottom of the table are regime-diagnostic: DXY vs SPX 60d normally runs negative (USD weakens in risk-on environments). When it turns positive, it signals USD funding stress — both USD and equities moving together, which historically precedes sharp risk-off moves. Gold vs DXY 60d normally runs negative. When it turns positive, it means both safe havens are rallying simultaneously — typically inflation-driven or geopolitical, rather than the usual USD-strength-suppresses-gold relationship. Hover over any row for a tooltip explaining the signal context.
Composite Stress Index
The REGIME badge is driven by a composite stress index. Each block is expressed as a z-score against its own trailing history (252 sessions; 504 for credit), so a reading of zero means average stress over that lookback and +1.0σ means one standard deviation above it. Published financial stress indices such as the OFR Financial Stress Index, the St. Louis Fed STLFSI and the Kansas City Fed KCFSI are likewise built so that zero is average stress. This index is the terminal's own construction on publicly available daily data and is not one of those published series.
OFR FSI reference. The OFR Financial Stress Index appears as a reference row in the Risk Monitor indicator table. It does not set the regime. The OFR publishes it two business days behind, and past values can be revised, so the row shows the date of the reading. Replayed over 2007-2026 (4,755 sessions in common), the composite correlates +0.83 with the OFR FSI expressed as a 252-day z-score and +0.46 with the FSI level. The FSI level averaged -1.69 on RISK-ON days, -0.18 on NEUTRAL days and +3.89 on RISK-OFF days. The two can read differently: the composite measures stress against the past year, while the FSI level measures it against its history since 2000, so a sharp rise in rate volatility and credit spreads can read RISK-OFF while the FSI level is still below average.
| Block | Input | Transform | Higher stress when |
|---|---|---|---|
| Equity Vol | VIX | Average of level z-score and 20-day change z-score | VIX rises |
| Rates Vol | MOVE index | Average of level z-score and 20-day change z-score | MOVE rises |
| Credit | US HY OAS and US IG OAS | Average of level and 20-day change z-scores over 504 sessions, then averaged across the two series | Spreads widen |
| FX Risk | AUD/JPY | Average of log-level z-score and 20-day log-return z-score, sign inverted | AUD/JPY falls |
| Equity Trend | S&P 500 | Z-score of drawdown from the trailing 252-session high, sign inverted | Drawdown deepens |
Each z-score is capped at ±3. The composite is the simple average of the available blocks and requires at least three of the five; with fewer, the badge shows a dash rather than a guess. The composite is then smoothed with a 3-session average and classified with hysteresis, so the label does not flip on small moves around a threshold.
| Smoothed composite | Regime | State transition |
|---|---|---|
| ≥ +1.0σ | RISK-OFF | Entered at +1.0σ; remains until the composite falls below +0.5σ |
| between | NEUTRAL | No strong cross-asset read in either direction |
| ≤ −0.5σ | RISK-ON | Entered at −0.5σ; remains until the composite rises above −0.25σ |
The sub-line under the badge names up to two blocks currently at or above +0.5σ, and the bars show every block's contribution. This matters because stress can be concentrated: a rates and credit shock can push the composite into RISK-OFF while equity volatility and the S&P 500 remain calm, and the reverse can also occur. The ±1.0σ and ±0.5σ thresholds were checked against 14 documented stress episodes between 2008 and 2025. RISK-OFF was reached in 13 of them, usually within a few sessions of onset; the Brexit vote peaked at +0.89σ and did not qualify. Over the full sample the regime changed about once a month, and the S&P 500's realized volatility over the following 20 sessions averaged roughly 26–31 in RISK-OFF, 15–17 in NEUTRAL and 11–12 in RISK-ON. Two limits apply: before 2020 only three of the five blocks are available, and the episode list is not exhaustive, so some RISK-OFF readings outside it are genuine stress. A search over alternative thresholds on pre-2020 data favored more sensitive settings that reached 9 of 9 early episodes but spent more time in RISK-OFF outside any episode, so the thresholds were left unchanged. Data are daily closes; the live quote replaces the current day's bar for VIX, MOVE, AUD/JPY and the S&P 500 when available, while HY and IG OAS come from FRED with a one-day lag, which is why those tiles show their own date. The credit series carry a shorter history than the equity series. The 10Y–3M curve inversion is no longer a regime input; it remains visible in the Yield Curve panel.
Point-Count Stress Score (Fair Value Input)
The earlier point-count stress score no longer drives the REGIME badge. It is still computed daily by the FX Fair Value input pipeline and supplies the numeric risk-sentiment input of the Fair Value regression, so that input series stays consistent across the regression's history. The regression consumes the number (0 to 10), not a regime label.
| Factor | Threshold | Points | Rationale |
|---|---|---|---|
| VIX | > 30 | +3 | Crisis / acute stress — GFC, COVID, 2022 spike |
| VIX | 25 – 30 | +2 | Elevated stress — tail risk visible |
| VIX | 18 – 25 | +1 | Uncertainty zone — below crisis, above complacency |
| VIX | < 18 | 0 | Neutral to risk-on |
| Yield curve | 10Y < 3M (inverted) | +1 | Recession signal — NY Fed / Campbell-Shiller |
| Gold intraday | > +2.0% | +1 | Safe-haven demand — threshold filters routine noise |
| SPX intraday | < −1.5% | +1 | Meaningful risk-off pressure — avoids routine dips |
| MOVE index | > 100 | +1 | Bond market stress — BofA/ICE "elevated" boundary |
| AUD/JPY intraday | < −1.5% | +1 | Canonical cross-asset risk barometer (JPM, Deutsche Bank, Bloomberg) — threshold calibrated to exclude routine CB-divergence noise |
| USD/JPY + AUD/JPY combo | USD/JPY < −1.0% and AUD/JPY < −0.5% | +1 | Yen safe-haven bid confirmed by AUD/JPY weakness — avoids double-counting pure USD moves |
| HY OAS 20d Δ | > +15bp (widening) | +1 | Credit-spread widening — the "silent killer" leading signal (credit stress precedes equity vol, e.g. 2007). Direction, not level, since OAS updates daily and can sit historically tight while still widening |
The maximum possible score is 10: VIX above 30 contributes 3 points and each of the other seven factors contributes 1. The credit factor uses direction rather than level because OAS updates daily and can sit historically tight while still widening.
VIX — CBOE Volatility Index
VIX measures the 30-day implied volatility of S&P 500 options. It is constructed from real option prices and represents the market's consensus expectation of near-term equity volatility. It is often called the "fear gauge."
| VIX Level | Regime | FX Implication |
|---|---|---|
| < 18 | Low / Complacency | Risk-on dominant. Carry trades perform. JPY/CHF weak. AUD/NZD/EM supported. |
| 18 – 25 | Moderate / Transitional | No strong directional bias from vol alone. Look at rate differentials for direction. |
| 25 – 30 | Elevated stress | Carry unwind risk. Begin monitoring JPY/CHF crosses for sudden strength. Watch DXY. |
| 30 – 40 | High / Significant stress | JPY/CHF sharply bid. AUD/NZD/EM selling off. USD typically strong (liquidity premium). |
| > 40 | Crisis / Panic | All correlations compress. Every safe haven bid simultaneously. Historical reference: COVID spike 85, GFC peak 89. |
MOVE Index — Bond Volatility
The ICE BofA MOVE Index measures implied volatility in US Treasury options across the 2Y, 5Y, 10Y, and 30Y tenors. It is the bond market's equivalent of the VIX. MOVE and VIX historically co-move, but divergences are highly significant for FX.
Normal MOVE range is 80–100. Levels above 100 mark the BofA/ICE "elevated" boundary — the level the Fair Value stress input treats as elevated (see Point-Count Stress Score above); in the composite, MOVE is scored against its own trailing year instead. Above 120 marks late-stage crisis conditions; the 2023 regional banking crisis pushed MOVE above 180, and the 2022 rate shock cycle saw sustained MOVE above 130.
MOVE vs VIX Divergence
Credit Spreads — HY/IG OAS
The ICE BofA US High Yield (HY) and US Investment Grade (IG) Option-Adjusted Spreads (OAS) measure the extra yield corporate bonds pay over Treasuries, adjusted for embedded call options — HY for below-investment-grade issuers (BB+/Ba1 and lower), IG for investment-grade issuers (BBB-/Baa3 and higher). Together they are the standard institutional gauge of corporate credit-market stress: a distinct risk channel from equity volatility (VIX) or bond volatility (MOVE), and one that has historically led both into genuine credit events rather than following them.
Credit spreads are not a niche addition to cross-asset risk frameworks — they are a standard leg of them. The Kansas City Fed's Risk-On/Risk-Off (RORO) Index explicitly combines credit spreads with equity volatility, funding conditions, and FX/gold into a single score, and the underlying research (Gilchrist & Zakrajšek, 2012, American Economic Review) finds that credit spreads drive the majority of the capital-flow effect in stress episodes — in some studies, more predictive of EM FX flows than VIX alone. CBOE and S&P's "credit VIX" indices formalize the same point: credit volatility is its own dimension, not something equity vol already captures.
The "Silent Killer" Pattern — Level vs. Direction
OAS updates daily, not intraday, and can sit in a historically tight zone while still actively widening — practitioners call this divergence the "silent killer": VIX and equities stay calm while credit quietly deteriorates, a pattern that preceded the 2007 credit crisis by months. The level alone misses this; the 20-day direction catches it. That's why the terminal shows both: HY OAS and IG OAS as levels in the Risk Monitor grid, and HY OAS 20d Δ as a separate derived row in the indicator table below it, following the same logic as the Gold/SPX and DXY/SPX correlation rows.
In the composite stress index, HY and IG OAS form the Credit block, scored on both level and 20-day change against their trailing year — see the Composite Stress Index table above. Showing the 20-day change next to the level matters because a spread can sit in a historically moderate range while widening quickly.
EUR/USD HV 30d
The HV30 (30-day realized historical volatility) of EUR/USD is calculated as the annualized standard deviation of daily log returns using daily OHLC price data. Unlike implied volatility, this is backward-looking — it measures how much the pair actually moved over the past 30 days, not how much the options market expects it to move. The HV30 value is also displayed inline in the FX Pairs table for each major pair.
Historical average is approximately 5–8%. Readings above 10% indicate an elevated recent volatility regime; above 12% reflects a period of genuine market stress (e.g., post-FOMC surprise, geopolitical shock). Low readings (below 5%) suggest a consolidation phase where breakouts are statistically more likely.
Gold as a Risk Signal
Gold's relationship with FX is more complex than "safe haven = gold up." The important relationships to monitor:
Asset Flow Logic — FX Implications
The following flows are structurally reliable across market cycles. Use them as a starting framework:
| If you see… | Expect pressure on… | Expect bid in… |
|---|---|---|
| VIX spike > 25 | AUD, NZD, CAD, EM | JPY, CHF, USD |
| Equities rallying broadly | JPY, CHF | AUD, NZD, CAD, EUR |
| Oil >+3% intraday | USD (if growth-driven) | CAD, NOK |
| US 10Y yield rising fast | Gold, EM, JPY (sometimes) | USD, carry longs |
| US 10Y yield falling fast | USD carry premium | Gold, JPY, EUR |
| DXY >+0.5% intraday | All major pairs (mechanical) | — |
| Nikkei >-2% intraday | USD/JPY (JPY strengthens) | JPY |
| MOVE > 130 sustained | EM, carry trades broadly | USD, CHF |
Divergence Signals
The most actionable signals come from divergences between cross-asset panels — when different asset classes are sending conflicting messages about risk appetite. These situations create high-probability setups because one market must eventually reprice toward the other.
When the Cross-Asset and Risk Monitor panels are all pointing the same direction, confidence in the regime signal is high. When they diverge, lower position sizing and wait for confirmation.
Historical VaR / CVaR Table
Below the Cross-Asset and Risk Monitor panels, a full-width table displays 1-day Historical VaR at 95% confidence and CVaR (Expected Shortfall) for 11 instruments: the 7 major FX pairs, XAU/USD, SPX, DXY, and VIX. The table is scrollable — the initial view shows EUR/USD through AUD/USD, with the remaining rows accessible by scrolling down.
Column definitions
VaR 95% — The 1-day Historical VaR at 95% confidence, as a percentage of price and for a long position: the loss that was exceeded on about 5% of the past 252 sessions. It is the linearly interpolated 5th percentile of the daily returns, converted to a simple percentage loss. The colour compares the instrument with itself, not with other instruments: green when the rolling 60-day VaR is below 0.8 times the 252-day level (calmer than its own year), red above 1.25 times (elevated), uncoloured in between. An asterisk (*) marks the same elevated condition. Absolute VaR levels differ by asset class, so they are not coloured against a common scale.
CVaR 95% — Expected Shortfall: the mean loss on the days at or beyond the VaR cut-off, about 13 of the 252 sessions. Always greater than or equal to the VaR. CVaR captures the average severity of tail events, not just their threshold.
ES/VaR ratio — CVaR divided by VaR. For normally distributed returns the ratio at 95% is about 1.25; a Student-t distribution with 5 degrees of freedom gives about 1.43 and with 3 degrees of freedom about 1.65. Heavier tails therefore show up as higher ratios. Color: green up to 1.4x, uncoloured from 1.4x to 1.6x, red above 1.6x.
n — Number of daily returns used in the computation. Target is 252 trading days (one year). A lower value means less historical data is available for that instrument.
Dollar Smile
Below the VaR/CVaR table, the Dollar Smile panel classifies USD performance by market regime, following Stephen Jen & Fatih Yilmaz's original 2001 framework (Morgan Stanley): the dollar tends to strengthen in a genuine global risk-off/crisis regime (safe-haven flows — the left tail) and when US growth significantly outperforms the rest of the G10 (yield/growth appeal — the right tail), and underperform in the calm middle, where capital drifts toward higher-yielding markets elsewhere. There is no official published Dollar Smile dataset — this panel is the terminal's own from-scratch implementation of the framework, with the full methodology disclosed rather than treated as a black box.
The chart carries two markers. The ● last reported quarter is the lagged historical classification, because GDP is published about a quarter after the period it measures. The ◎ current read places today's conditions on the same curve using daily market data. Under the chart, a current-read block gives the branch and the indicators behind it: the Risk Monitor stress composite (state and sigma level), the US 2-year yield minus the equal-weight average 2-year yield of EUR, GBP, JPY, AUD, CAD, CHF, SEK and NZD (level in basis points, 20-session change and a z-score against the trailing 252 observations), and the 20-session change of the DXY with its z-score and percentile. The last line gives the date of each series.
The branch is Left when the Risk Monitor composite is RISK-OFF; Right when the 2-year differential z-score is at or above +0.5 and the last reported GDP differential favours the US; Middle otherwise. When the branch is Left, the block names the leading stress blocks, so a rates-and-credit shock with muted equity volatility is distinguishable from an equity-led panic. The table at the bottom, By regime bucket, remains the historical record of how the dollar behaved in each regime.
The regime axis of the historical study is the real US-vs-G9 GDP YoY growth differential, computed from FRED data across all G10 currencies — not a proxy or a single-country comparison. Critically, the left tail (genuine crisis) is not simply "the US grew a bit slower than its peers": an independent crisis check (max quarterly VIX close ≥ 40, or max quarterly OFR Financial Stress Index ≥ 6) overrides the growth-differential classification for that tail. This matters because in a real synchronized global crisis, the rest of the G9 typically contracts as much as or more than the US — a pure growth-differential split would never actually populate the "crisis" bucket correctly without this override.
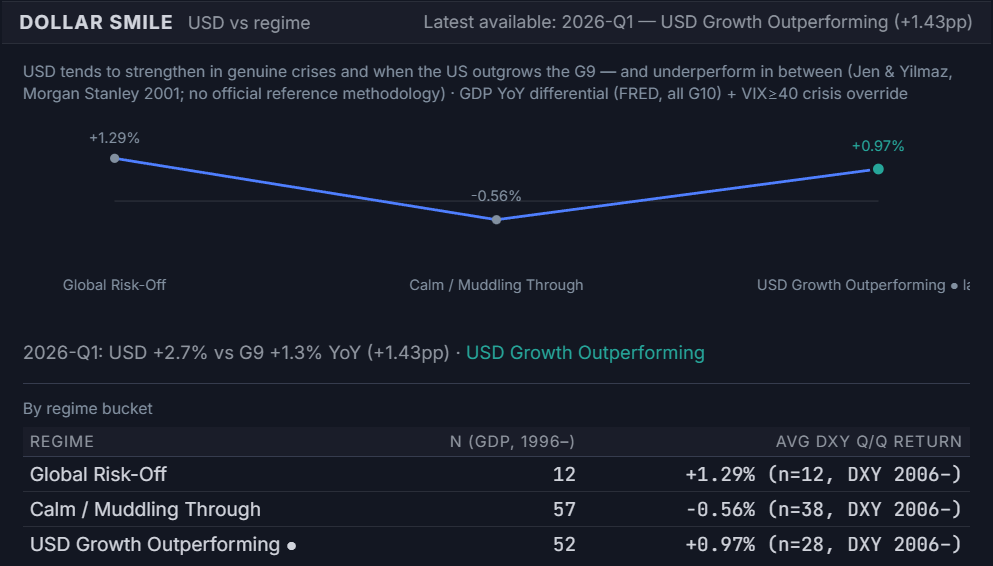
Three regime buckets are shown, each with its own sample size (quarters classified, full history since 1996) and average DXY quarter-over-quarter return:
- Global Risk-Off — the left tail: a genuine stress quarter per the crisis override (VIX≥40 or OFR FSI≥6), regardless of what the growth differential alone would suggest. USD typically strengthens here on safe-haven demand.
- Calm/Muddling Through — the middle of the smile: no crisis override triggered, and the US-vs-G9 growth differential is not strongly skewed either direction. USD typically underperforms here as capital seeks yield elsewhere.
- USD Growth Outperforming — the right tail: the US is growing meaningfully faster than the G9 average, with no crisis override. USD typically strengthens here on relative growth and yield appeal.
FX Fair Value
Below Dollar Smile, the FX Fair Value panel takes a per-pair rather than USD-wide view: for each of the 32 tracked pairs, it fits a BEER-style (Behavioral Equilibrium Exchange Rate) regression and expresses the live spot rate as a Z-score deviation from the model's fair value estimate. Where Dollar Smile classifies the dollar into one of three discrete regime buckets, FX Fair Value gives a continuous, per-pair valuation reading — the two panels are complementary lenses on the same underlying question of whether a currency's current price is justified by its fundamentals.
The regression combines five inputs: the interest-rate differential, a risk-sentiment score, GDP-normalized Current Account (a net-foreign-assets proxy), GDP-normalized Trade Balance (a terms-of-trade proxy), and a productivity growth-rate differential (a Balassa-Samuelson proxy — an economy whose tradable-sector productivity grows faster than its peers tends to see its real exchange rate appreciate over time). The risk score input is the point-count stress score documented above in this guide's Risk Monitor section — a separate series from the composite regime shown on the Risk Monitor badge. It is one shared, market-wide reading, which is why every pair's Risk Score column moves together on the same day.
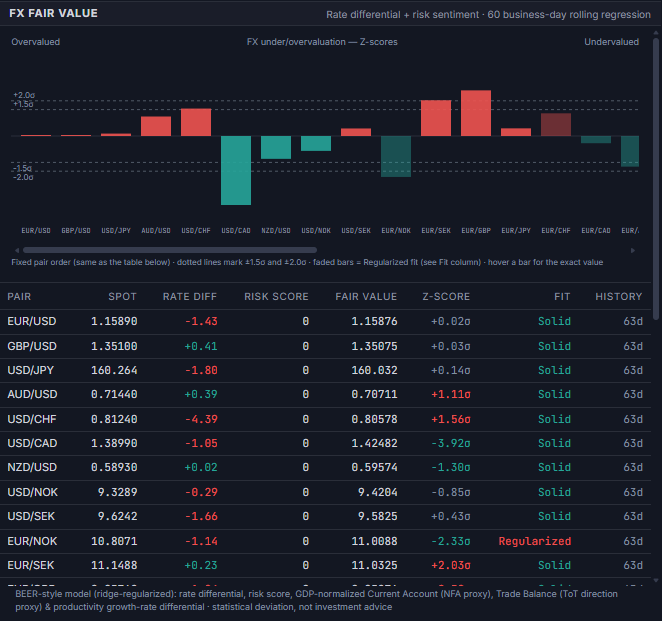
Each pair's regression is fitted independently over a rolling 60 business-day window, using ridge regression with the penalty (λ) chosen by blocked 5-fold cross-validation — the standard remedy when a multi-factor design matrix is collinear across several of the 32 pairs, which is the case here since daily FX spot is genuinely noisy relative to a 5-variable macro regression. The Z-score itself is computed walk-forward (fit on a window excluding the most recent row, then that row is scored against the fit) to avoid look-ahead bias.
The Fit column discloses, independently of the CV-selected λ, whether a pair is well-identified under plain OLS (Solid) or whether ridge is doing real shrinkage work (Regularized) — a large λ alone isn't a reliable confidence signal, since cross-validated ridge shrinks hard almost everywhere once daily FX proves noisy, independent of whether a specific pair's design is actually collinear. A pair with fewer than 60 real logged trading days shows an honest accumulation-progress state instead of a number — the model never fabricates history to show a result sooner.
Regime Episodes — Cross-Asset Flow Relationships
The interaction between rates, equities, commodities, and FX is most visible during documented regime transitions. The following episodes illustrate how cross-asset flows transmit across markets — and how the signals available in this terminal would have characterized each regime in real time.
These are not backtested strategies. They are historical descriptions of how asset class relationships behaved, drawn from publicly documented market data. The purpose is calibration: understanding what each indicator looked like during an actual stress episode makes the live readings more interpretable.
2022 — Rates shock: simultaneous equity and bond selloff
The Fed's fastest hiking cycle since the 1980s produced a regime that broke the standard equity/bond correlation. Bonds and equities fell together — the traditional 60/40 diversification mechanism failed. Cross-asset implications were severe and unusual.
| Indicator | Observed behavior | FX implication |
|---|---|---|
| VIX | Ranged 20–36, repeatedly spiked but did not sustain crisis levels | Intermittent JPY/CHF bids, no sustained safe-haven flow |
| MOVE Index | Sustained above 130; peaked near 160 in Oct 2022 | USD dominant — policy uncertainty drove USD liquidity premium across all pairs |
| DXY vs SPX 60d corr. | Turned positive — both USD and equities moved together at times | Classic USD funding stress signal; EUR/USD broke parity in September 2022 |
| Gold vs DXY 60d corr. | Remained negative — gold sold off with risk assets | AUD/USD and NZD/USD under sustained pressure; commodity price rally partially offset |
| US 10Y yield | Rose from 1.5% to 4.25% through the year | USD carry premium dominated; JPY hit multi-decade lows vs USD |
2023 Q1 — Regional banking stress: MOVE spike, VIX lagged
The failure of Silicon Valley Bank and Signature Bank in March 2023 generated acute stress in US regional bank credit — but equity markets recovered quickly. MOVE spiked to 180 (its highest since the 2008–09 crisis) while VIX peaked near 26 and retreated. This divergence had specific FX consequences.
| Indicator | Observed behavior | FX implication |
|---|---|---|
| MOVE Index | Spiked to 180 in March 2023 — highest since GFC | USD initially weakened as rate cut expectations surged; the market priced Fed pivoting within months |
| VIX | Peaked near 26, then retreated below 20 by April | Equity market did not treat this as a systemic crisis — carry trades recovered quickly |
| Gold vs DXY | Both rallied simultaneously in March — positive correlation | Rare signal: geopolitical/credit stress, not a standard risk-off move. EUR/USD rose alongside gold despite USD volatility |
| US 2Y yield | Fell 100bp in five trading days — the fastest drop since 1987 | USD weakened sharply; EUR/USD jumped from 1.055 to 1.090 in the episode |
2024 August — JPY carry unwind: VIX spike, Nikkei collapse
In early August 2024, the Bank of Japan raised rates and signaled further tightening. The JPY carry trade — where investors borrow in JPY at near-zero rates to fund positions in higher-yielding assets — unwound at speed. The episode is the canonical example of how a single CB policy shift can trigger cross-asset deleveraging.
| Indicator | Observed behavior | FX implication |
|---|---|---|
| VIX | Spiked from 16 to 65 intraday on 5 August — fastest spike in the index's history | Extreme risk-off; all carry trades unwound simultaneously |
| Nikkei 225 | Fell 12.4% on 5 August — largest single-day drop since 1987 | USD/JPY fell from 158 to 142 within days; JPY strengthened across all crosses |
| AUD/JPY, NZD/JPY | Both fell 10%+ in the episode — largest carry pairs most affected | High-yield currencies vs JPY are the primary expression of carry trade positioning |
| BTC/USD | Fell 15% on 5 August, preceding the Nikkei open | BTC as leading carry risk indicator — the move preceded the equity selloff by hours |
| MOVE Index | Remained moderate — this was not a bond market stress event | Confirmed as equity/carry unwind, not a rates or credit crisis; bond markets were calm |
2025 Q1 — Tariff shock: gold/USD positive correlation
The announcement of broad US import tariffs in early 2025 produced a cross-asset configuration that was initially misread by markets: the USD weakened while gold rallied, and US equities fell while European equities outperformed. This violated several standard risk-off assumptions.
| Indicator | Observed behavior | FX implication |
|---|---|---|
| Gold vs DXY 60d corr. | Turned sharply positive — gold and USD moving in the same direction was rare | USD funding stress signal; markets questioned USD reserve status in the medium term |
| DXY vs SPX 60d corr. | Also turned positive — USD weakened alongside equities | Unusual: typically USD strengthens in risk-off. Suggested US-specific risk premium |
| EUR/USD | Rose from 1.03 to 1.12 through Q1 2025 — one of the sharpest quarterly moves since 2017 | EUR outperformed despite European growth concerns; tariffs seen as a greater US growth risk |
| VIX | Elevated (25–35) but not crisis levels | Sustained caution regime; carry trades impaired but not fully unwound |
| Gold | Set successive all-time highs above $3,000 through Q1 | Gold/USD positive correlation alongside DXY weakness = structural USD confidence erosion, not a typical risk-off episode |
Crypto as a Cross-Asset Risk Indicator
Bitcoin and the broader crypto market occupy a structurally specific role in the cross-asset framework: they function as a high-beta, 24/7 risk sentiment proxy, with particular relevance during the Asia session when traditional risk assets are closed. This role is distinct from crypto's intrinsic investment case and does not require any view on its long-term value.
The mechanism is straightforward. BTC/USD trades continuously and is held disproportionately by speculative participants who also hold leveraged positions in equities, carry trades, and risk assets. When margin calls or risk-off impulses hit in the Asia session, crypto is often the first liquid market to reflect the move — before Tokyo or Sydney equity markets open. Professional FX desks monitor BTC as a leading indicator for this reason, not as a primary position.
The Asia session leading indicator
The most operationally relevant BTC/FX relationship occurs between approximately 18:00 and 02:00 UTC — the period when US and European equity markets are closed but Asia equity markets are either approaching open (Tokyo: 00:00 UTC) or in early session. During this window, BTC/USD is one of the only continuously traded, institutionally relevant risk assets available.
| BTC behavior | Asia session implication | FX pairs to watch |
|---|---|---|
| BTC falls >3% in Asia pre-session (18:00–00:00 UTC) | Risk-off impulse likely to carry into Nikkei open; USD/JPY may weaken as Tokyo opens | USD/JPY, AUD/JPY, AUD/USD |
| BTC rallies >3% with Nikkei futures bid | Risk-on Asia session; carry trades supported through London open | AUD/USD, NZD/USD, AUD/JPY |
| BTC sells off sharply while gold rallies | Flight to traditional safe havens; not a crypto-specific move — systemic signal | JPY, CHF, gold-sensitive pairs |
| BTC and DXY both falling together | Rare — risk-on with non-USD flows; capital rotating toward EM and commodity currencies | AUD/USD, NZD/USD, EM broadly |
BTC and AUD/USD — structural positive correlation
Among major FX pairs, AUD/USD has shown the most consistent positive correlation with BTC/USD over rolling 60-day windows. Both assets are high-beta risk proxies with significant Asia-Pacific institutional ownership. The correlation is not static — it strengthens during risk-off episodes (both fall together) and weakens during crypto-specific narratives (e.g., ETF approvals, halving events) when BTC moves independently of macro conditions.
Limits of the indicator
The BTC/FX relationship is probabilistic and regime-dependent, not mechanical. Several conditions cause it to break down:
- Crypto-specific catalysts — regulatory decisions, ETF flows, protocol upgrades, and exchange-specific events move BTC independently of macro. During these episodes, the leading-indicator property is suspended.
- Low-liquidity gaps — weekend moves in crypto do not always transmit to FX on Monday open. Monday open gaps in FX are more often driven by weekend CB decisions, geopolitical events, or economic data releases than by crypto price action.
- Late-cycle carry regimes — in strongly trending carry environments (e.g., early 2024), FX carry pairs can maintain their trend even as BTC corrects, because the carry differential outweighs the risk sentiment signal.
- Crisis-level VIX — when VIX is above 40, traditional safe-haven flows (JPY, CHF, USD) dominate and the BTC signal is subsumed by the broader risk-off environment. At extreme stress levels, all correlations compress and cross-asset relationships become unreliable.
Current risk regime score, VIX, MOVE Index, yield curve, SPX, gold, and the full cross-asset panel — updated every 15 minutes. Available on the web terminal and natively inside MetaTrader 5 through the companion Expert Advisor — both unlock under a single EA rental on MQL5 Market.
Frequently Asked Questions
What is the cross-asset risk regime and how does it affect FX?
The cross-asset risk regime is a composite signal that classifies market conditions as RISK-ON or RISK-OFF based on multiple asset classes: VIX (equity volatility), MOVE Index (bond volatility), gold, SPX (S&P 500), DXY (US Dollar Index), and the yield curve. In risk-on regimes, high-yield currencies (AUD, NZD, GBP) and carry pairs (GBP/JPY, AUD/JPY) tend to outperform. In risk-off regimes, safe-haven flows benefit JPY, CHF, and USD while high-beta pairs sell off.
How does VIX affect FX currency pairs?
VIX (the CBOE Volatility Index) measures implied volatility on the S&P 500. When VIX rises above 20, carry trades — where traders borrow in low-yield currencies (JPY, CHF) to buy high-yield ones — begin to unwind. A VIX spike above 30 typically triggers aggressive JPY and CHF buying, sharp sell-offs in AUD, NZD, GBP, and liquidation of cross pairs like GBP/JPY and AUD/JPY. VIX below 15 is the environment most favorable for carry and momentum strategies.
What are cross-asset flow relationships in FX?
Cross-asset flow relationships describe how capital moves between asset classes and affects currency demand. Key relationships include: USD tends to rise when US yields rise relative to global peers; JPY strengthens when global equities fall or bond yields drop sharply; commodity currencies (AUD, CAD, NZD) correlate with commodity prices and China growth expectations; gold rises with USD weakness and during geopolitical stress, which can create complex multi-directional flows.
How is the cross-asset risk regime calculated in the terminal?
The regime is a composite stress index. Five blocks are each converted to a z-score against their trailing history (252 sessions; 504 for credit, whose spreads cycle more slowly), averaging the level and the 20-day change: equity volatility (VIX), rates volatility (MOVE), credit (US HY and IG OAS), FX risk (AUD/JPY, sign inverted) and equity trend (S&P 500 drawdown from its 252-day high). The blocks are averaged, smoothed over three sessions and classified with hysteresis: RISK-OFF is entered at +1.0σ and left below +0.5σ; RISK-ON is entered at −0.5σ and left above −0.25σ; anything in between is NEUTRAL. Zero equals the average stress level over each block’s lookback.